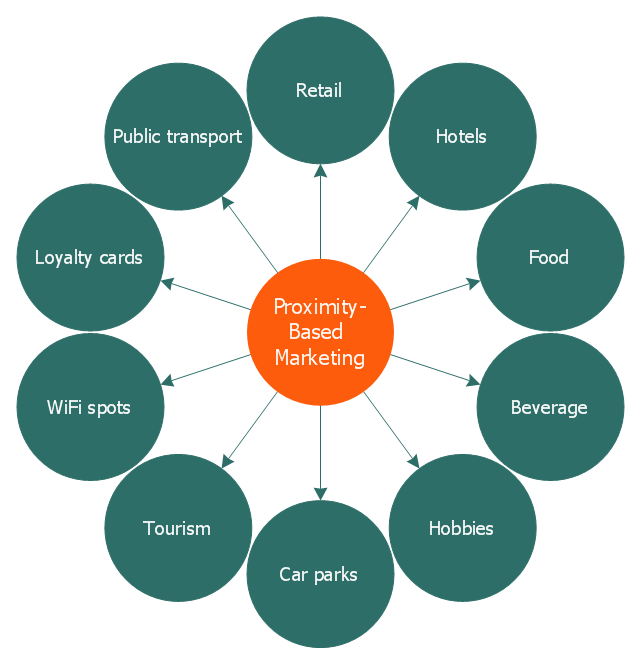
This circle-spoke diagram sample illustrates the proximity marketing.
"Proximity marketing is the localized wireless distribution of advertising content associated with a particular place. Transmissions can be received by individuals in that location who wish to receive them and have the necessary equipment to do so.
Distribution may be via a traditional localized broadcast, or more commonly is specifically targeted to devices known to be in a particular area.
The location of a device may be determined by:
(1) A cellular phone being in a particular cell.
(2) A Bluetooth or WiFi device being within range of a transmitter.
(3) An Internet enabled device with GPS enabling it to request localized content from Internet servers.
(4) A NFC enabled phone can read a RFID chip on a product or media and launch localized content from internet servers.
Communications may be further targeted to specific groups within a given location, for example content in tourist hot spots may only be distributed to devices registered outside the local area.
Communications may be both time and place specific, e.g. content at a conference venue may depend on the event in progress.
Uses of proximity marketing include distribution of media at concerts, information (weblinks on local facilities), gaming and social applications, and advertising." [Proximity marketing. Wikipedia]
The hub-and-spoke diagram example "Proximity based marketing" was created using the ConceptDraw PRO diagramming and vector drawing software extended with the Circle-Spoke Diagrams solution from the area "What is a Diagram" of ConceptDraw Solution Park.
Circle-spoke diagram
Best Diagramming


 Circle-Spoke Diagrams
Examples of subject areas that are well suited to this approach are marketing, business, products promotion, process modeling, market, resource, time, and cost analysis. Circle-Spoke Diagrams are successfully used in presentations, conferences, management documents, magazines, reportages, reviews, reports, TV, and social media.
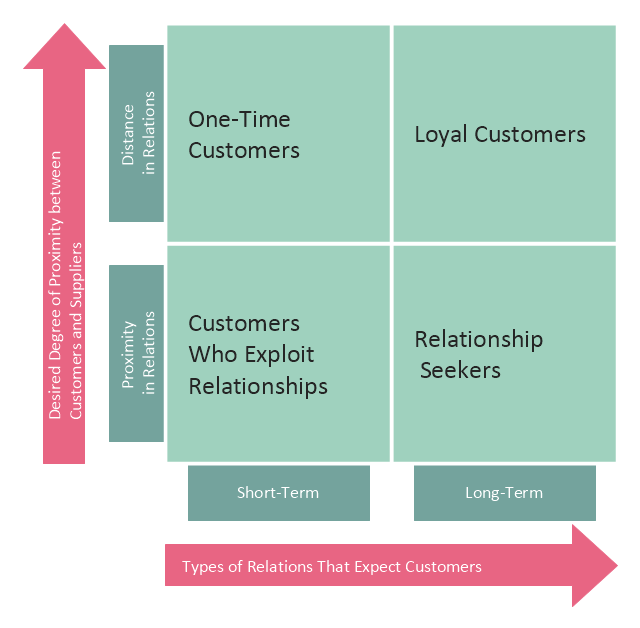
This customer types matrix diagram distribute customers into four categories depending of two criteria: 1) desired degree of proximity between customers and suppliers, and 2) types of relations that expect customers.
One time customers have short-term relations with suppliers and characterized by distance in relations with them.
Loyal customers have long-term relations with suppliers and characterized by distance in relations with them.
Customers who exploit relationships have short-term relations with suppliers and characterized by proximity in relations with them.
Relationship seekers have long-term relations with suppliers and characterized by proximity in relations with them.
This customer types matrix diagram example was created using the ConceptDraw PRO diagramming and vector drawing software extended with the Matrices solution from the Marketing area of ConceptDraw Solution Park.
Customer types diagram
How To Create a Workflow Diagram

Circle Spoke Diagram Template

Best Vector Drawing Application for Mac OS X

 Bubble Diagrams
Bubble diagrams have enjoyed great success in software engineering, architecture, economics, medicine, landscape design, scientific and educational process, for ideas organization during brainstorming, for making business illustrations, presentations, planning, design, and strategy development. They are popular because of their simplicity and their powerful visual communication attributes.
Scatter Graph

Near-me area networks (NAN). Computer and Network Examples
. Computer and Network Examples")

Sentence Diagrammer

Blank Scatter Plot

 What is a Diagram Area
Solutions of the area What is a Diagram from ConceptDraw Solution Park collect templates, samples and vector stencils libraries for drawing diagrams visualizing qualitative information and knowledge.
Home area networks (HAN). Computer and Network Examples
")
Physical Security Plan

- Circle-spoke diagram - Proximity based marketing | Venn Diagrams ...
- Proximity Chart
- Best Diagramming | Proximity based marketing | Near-me area ...
- Proximity Charts
- Proximity Marketing In Marketing Management Diagram
- Proximity based marketing | Circular Diagram | BPMN 2.0 ...
- Proximity Diagrams
- Proximity Chart Of Bubble Diagram Of A House
- Proximity Chart Architectural Template Excel
- Proximity Relationship Diagram Architecture
- Best Diagramming | Circle-Spoke Diagrams | Geo Map - Europe ...
- Architectural Proximity Chart
- Proximity Diagram For School Architecture
- Proximity Chart In Architecture
- Draw The Neat Diagram Symbol Of The Proximity Sensor
- What Is a Circle Spoke Diagram | Circle Diagrams | Proximity based ...
- How to Add a Circle-Spoke Diagram to a MS Word Document Using ...
- How To Represent Proximity Chart
- Proximity Chart Ideas