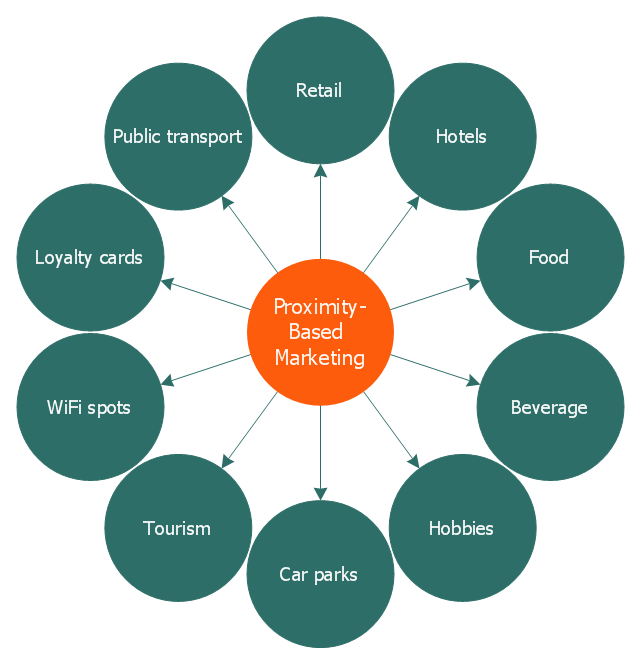
This circle-spoke diagram sample illustrates the proximity marketing.
"Proximity marketing is the localized wireless distribution of advertising content associated with a particular place. Transmissions can be received by individuals in that location who wish to receive them and have the necessary equipment to do so.
Distribution may be via a traditional localized broadcast, or more commonly is specifically targeted to devices known to be in a particular area.
The location of a device may be determined by:
(1) A cellular phone being in a particular cell.
(2) A Bluetooth or WiFi device being within range of a transmitter.
(3) An Internet enabled device with GPS enabling it to request localized content from Internet servers.
(4) A NFC enabled phone can read a RFID chip on a product or media and launch localized content from internet servers.
Communications may be further targeted to specific groups within a given location, for example content in tourist hot spots may only be distributed to devices registered outside the local area.
Communications may be both time and place specific, e.g. content at a conference venue may depend on the event in progress.
Uses of proximity marketing include distribution of media at concerts, information (weblinks on local facilities), gaming and social applications, and advertising." [Proximity marketing. Wikipedia]
The hub-and-spoke diagram example "Proximity based marketing" was created using the ConceptDraw PRO diagramming and vector drawing software extended with the Circle-Spoke Diagrams solution from the area "What is a Diagram" of ConceptDraw Solution Park.
Circle-spoke diagram
 Data Flow Diagrams (DFD)
Data Flow Diagrams solution extends ConceptDraw PRO software with templates, samples and libraries of vector stencils for drawing the data flow diagrams (DFD).
 Venn Diagrams
Venn Diagrams are actively used to illustrate simple set relationships in set theory and probability theory, logic and statistics, mathematics and computer science, linguistics, sociology, and marketing. Venn Diagrams are also often used to visually summarize the status and future viability of a project.
 Basic Venn Diagrams
This solution extends ConceptDraw PRO v10 (or later) with samples, templates, and libraries of vector stencils for drawing Venn Diagrams.
This Venn diagram sample shows the relations between Internet marketing professions.
"Online advertising, also called Internet advertising, uses the Internet to deliver promotional marketing messages to consumers. It includes email marketing, search engine marketing, social media marketing, many types of display advertising (including web banner advertising), and mobile advertising. Like other advertising media, online advertising frequently involves both a publisher, who integrates advertisements into its online content, and an advertiser, who provides the advertisements to be displayed on the publisher's content. Other potential participants include advertising agencies who help generate and place the ad copy, an ad server who technologically delivers the ad and tracks statistics, and advertising affiliates who do independent promotional work for the advertiser." [Online advertising. Wikipedia]
The diagram example "Internet marketing professions" was created using the ConceptDraw PRO diagramming and vector drawing software extended with the Venn Diagrams solution from the area "What is a Diagram" of ConceptDraw Solution Park.
Venn diagram

HelpDesk
How to Create a Cloud Computing Diagram Using ConceptDraw PRO

 Network Layout Floor Plans
Network Layout Floor Plan solution extends ConceptDraw PR software with samples, templates and libraries of vector stencils for drawing the computer network layout floor plans.
- How to Add a Circle -Spoke Diagram to a MS Word Document Using ...
- Internet marketing - Concept map | Leaky bucket diagram | What Is a ...
- The Best Choice for Creating Diagram | Concept Maps | How to ...
- Internet Circle Logo Blue Png
- Venn Diagram | 3 Circle Venn Diagram . Venn Diagram Example | 3 ...
- Internet marketing professions | Venn Diagram | Venn Diagram ...
- Venn diagram - Internet marketing professions | Wireless Networks ...
- Internet marketing - Concept map | Target market | How to Draw a ...
- Circle -Spoke Diagrams | Venn Diagram | Cisco Network Diagrams ...