ERD Symbols and Meanings
Crow's foot notation is used in Barker's Notation, Structured Systems Analysis and Design Method (SSADM) and information engineering. Crow's foot diagrams represent entities as boxes, and relationships as lines between the boxes. Different shapes at the ends of these lines represent the cardinality of the relationship.The Chen's ERD notation is still used and is considered to present a more detailed way of representing entities and relationships.
To create an ERD, software engineers mainly turn to dedicated drawing software, which contain the full notation resources for their specific database design - ERD symbols and meanings. CS Odessa has released an all-inclusive Entity-Relationship Diagram (ERD) solution for their powerful drawing program, ConceptDraw DIAGRAM.
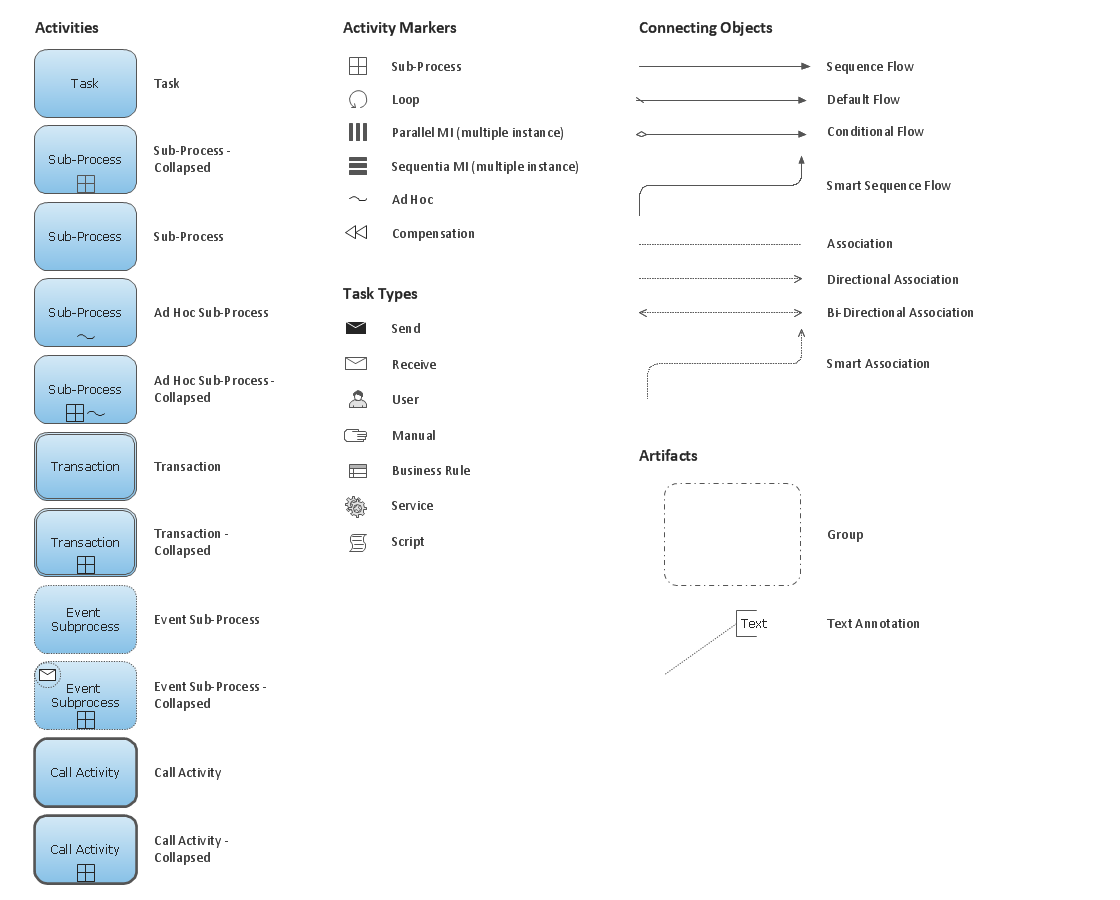
Business Process Elements: Activities
Create professional business process diagrams using ConceptDraw Activities library with 34 objects from BPMN.
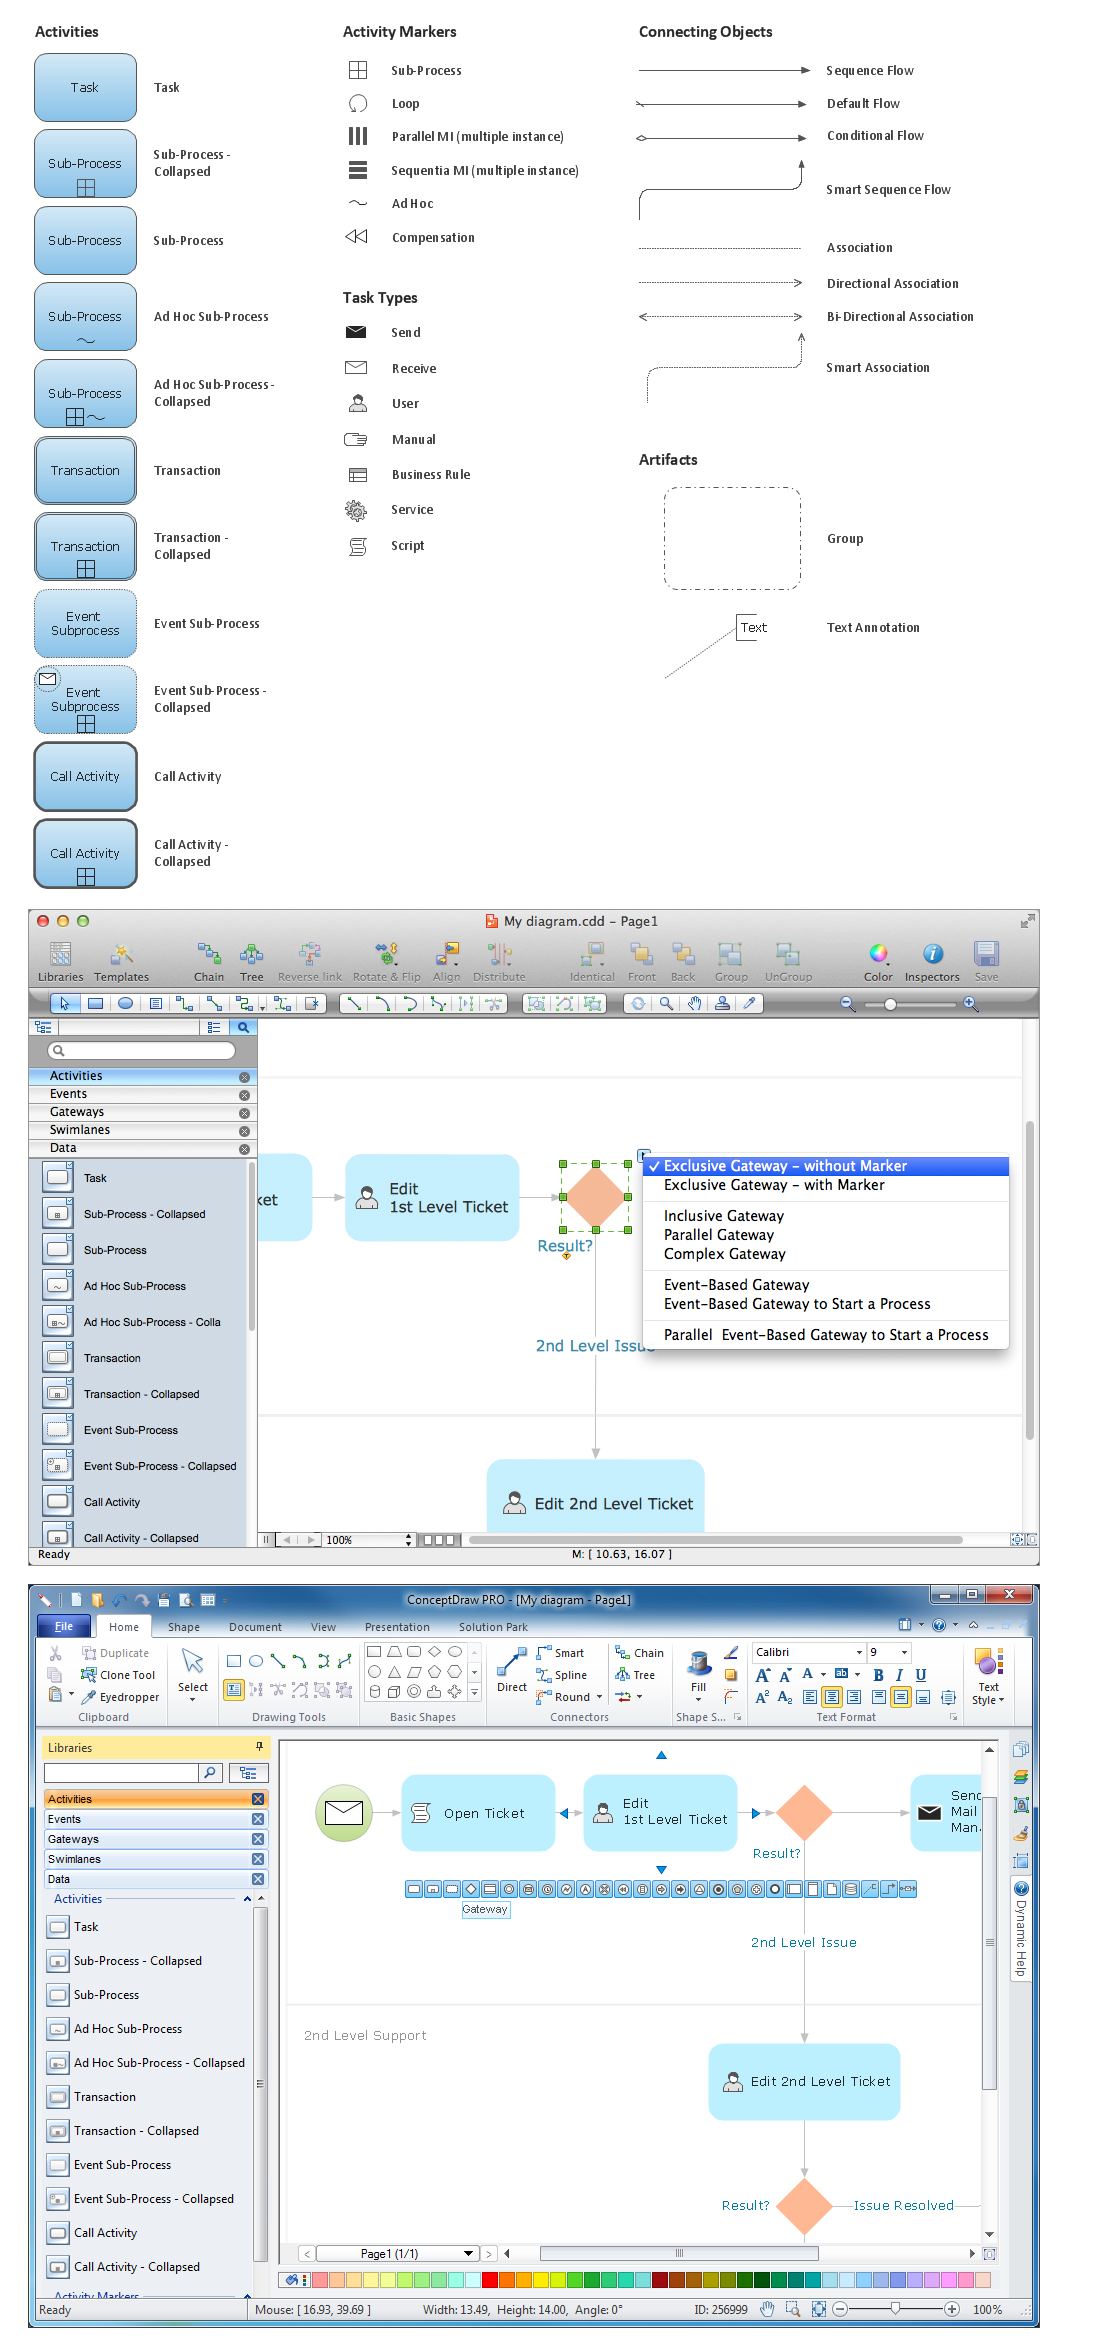
Diagramming Software for Business Process
Create professional business process diagram with ConceptDraw Activities library with 34 objects from BPMN.AWS Architecture Diagrams
AWS Architecture Diagrams with powerful drawing tools and numerous predesigned Amazon icons and AWS simple icons is the best for creation the AWS Architecture Diagrams, describing the use of Amazon Web Services or Amazon Cloud Services, their application for development and implementation the systems running on the AWS infrastructure. The multifarious samples give you the good understanding of AWS platform, its structure, services, resources and features, wide opportunities, advantages and benefits from their use; solution’s templates are essential and helpful when designing, description and implementing the AWS infrastructure-based systems. Use them in technical documentation, advertising and marketing materials, in specifications, presentation slides, whitepapers, datasheets, posters, etc.
Pyramid Diagram
Those triangles within any technical analysis are known to be the chart patterns that can be commonly found in the price charts of the financially traded assets, such as stocks, futures, bonds, etc. The pattern is known to be deriving its name from the fact that it is characterized by some contraction in a price range being the converged trend lines, giving it a triangular shape.Database Design
ConceptDraw DIAGRAM extended with IDEF Business Process Diagrams solution from the Business Processes area of ConceptDraw Solution Park is an ideal software for effective database design and drawing IDEF diagrams visually representing all steps of database design process.HelpDesk
How to Draw a Histogram
Histogram is a diagram used to visualize data through bars of variable heights. Making histogram can be helpful if you need to show data covering various periods (hours, days, weeks, etc). When the vertical column of the histogram refer to frequency it shows how many times any event happens. It is a Frequency histogram. A bar chart diagram is similar to a histogram, but in contrast to a bar chart a histogram represents the number how many times there have been certain data values. You can use a histogram to depict continual data flow such as temperature, time, etc. You can effortlessly draw histograms using the Histograms solution for CnceptDraw DIAGRAM. Making a histogram can by very useful to represent various statistical data.Fishbone Diagram Problem Solving
The Ishikawa diagram, Cause and Effect diagram, Fishbone diagram — all they are the names of one and the same visual method for working with causal connections. Originally invented by Kaoru Ishikawa to control the process quality, the Ishikawa diagram is well proven in other fields of management and personal scheduling, events planning, time management. It is a chart in the form of a fish, whose head is a problem, the fins are variants for its causes.To design easily the Fishbone diagram, you can use a special ConceptDraw DIAGRAM vector graphic and diagramming software which contains the powerful tools for Fishbone diagram problem solving offered by Fishbone Diagrams solution for the Management area of ConceptDraw Solution Park.
Education Package
Education Package is a comprehensive set of multifarious graphical solutions from ConceptDraw Solution Park, collected together in help to ConceptDraw DIAGRAM users working in a field of science, education and training, which is aimed at improving the quality of education and helping to design with ease variety of interesting and colorful educational materials, diagrams, charts and maps. Use it to present the information and knowledge in an interesting, clear, structured and simple form to achieve a success in education and pedagogy, to maintain the interest of students and pupils throughout the whole learning process, at the lectures, lessons and even during independent work with additional materials, to contribute to better perception of scientific information by listeners during the conferences and reports.
Website Wireframe
The innovative Website Wireframe solution enhances the ConceptDraw DIAGRAM functionality with newest wireframe tools, libraries with variety of predesigned icons, symbols, buttons, graphics, forms, boxes, and many other vector elements, templates and professionally designed samples, which make it the best wireframing software. Website Wireframe solution gives you significant advantages when designing and maintaining websites, creating skeletal and content-free depictions of website structure, making website prototypes and planning the content arrangement before committing to design, also speeds up the processes of sketching, producing and sharing wireframe examples of website style and interface design.
- Swim Lane Diagrams | Swim Lane Flowchart Symbols | Cross ...
- Design elements - Bank UML component diagram | Design ...
- Entity Relationship Diagram Symbols | ERD Symbols and Meanings ...
- Mobile satellite TV network diagram | UML use case diagram ...
- ATM UML Diagrams | Design elements - Activities BPMN 1.2 ...
- How To Draw Uml Diagram In Laptop Using
- Website Wireframe | UML activity diagram - Servlet container | How ...
- Meaning Of Dotted Line In Er Diagram
- Design elements - Gateways and artifacts BPMN 1.2 | AWS Security ...
- 3-Tier Auto-scalable Web Application Architecture | Visio Exchange ...
- ERD | Entity Relationship Diagrams, ERD Software for Mac and Win
- Flowchart | Basic Flowchart Symbols and Meaning
- Flowchart | Flowchart Design - Symbols, Shapes, Stencils and Icons
- Flowchart | Flow Chart Symbols
- Electrical | Electrical Drawing - Wiring and Circuits Schematics
- Flowchart | Common Flowchart Symbols