 Website Wireframe
The innovative Website Wireframe solution enhances the ConceptDraw DIAGRAM functionality with newest wireframe tools, libraries with variety of predesigned icons, symbols, buttons, graphics, forms, boxes, and many other vector elements, templates and professionally designed samples, which make it the best wireframing software. Website Wireframe solution gives you significant advantages when designing and maintaining websites, creating skeletal and content-free depictions of website structure, making website prototypes and planning the content arrangement before committing to design, also speeds up the processes of sketching, producing and sharing wireframe examples of website style and interface design.
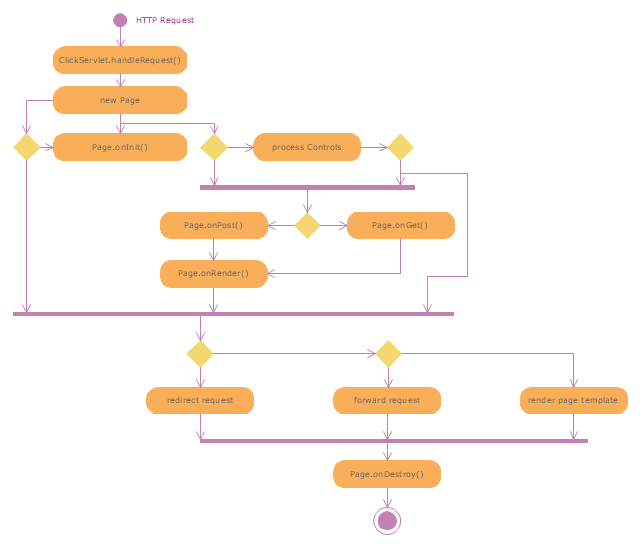
"Web container (also known as a Servlet container) is the component of a web server that interacts with Java servlets. A web container is responsible for managing the lifecycle of servlets, mapping a URL to a particular servlet and ensuring that the URL requester has the correct access rights. A web container implements the web component contract of the Java EE architecture, specifying a runtime environment for web components that includes security, concurrency, lifecycle management, transaction, deployment, and other services. A web container provides the same services as a JSP container as well as a federated view of the Java EE platform APIs." [Web container. Wikipedia]
The UML activity diagram example "Servlet container" was created using the ConceptDraw PRO diagramming and vector drawing software extended with the Rapid UML solution from the Software Development area of ConceptDraw Solution Park.
The UML activity diagram example "Servlet container" was created using the ConceptDraw PRO diagramming and vector drawing software extended with the Rapid UML solution from the Software Development area of ConceptDraw Solution Park.
UML activity diagram
How To create Diagrams for Amazon Web Services architecture
HelpDesk
How to Make a Web Page from Your Metro Map

HelpDesk
How to Save a Diagram as a Web Page

HelpDesk
How to Publish Project Reports to a Web Site

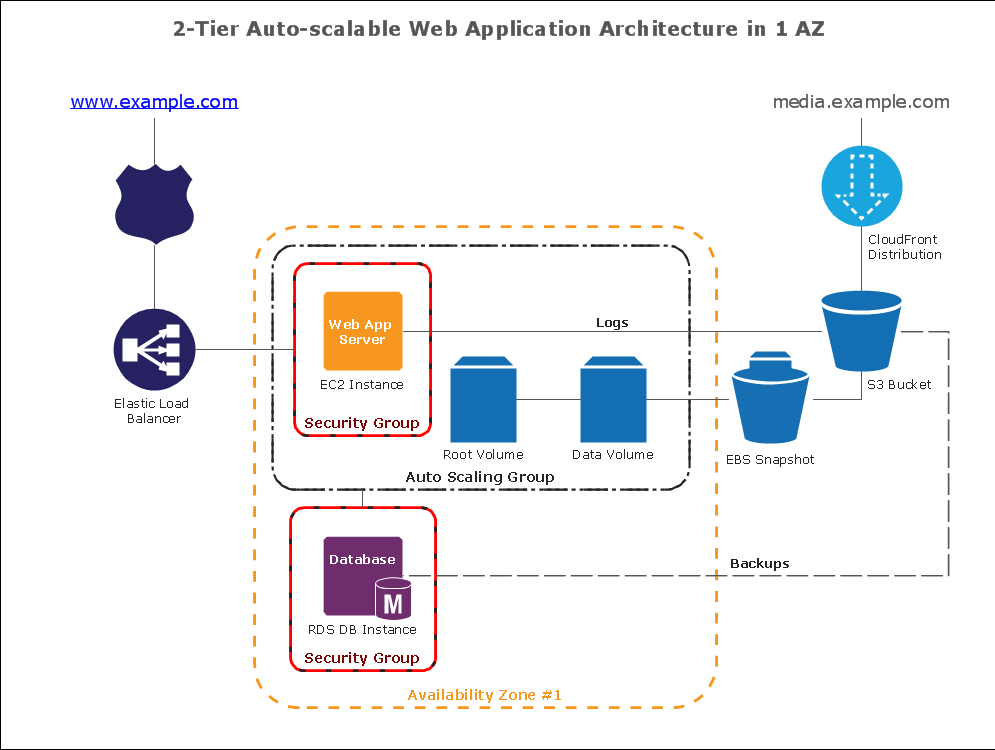
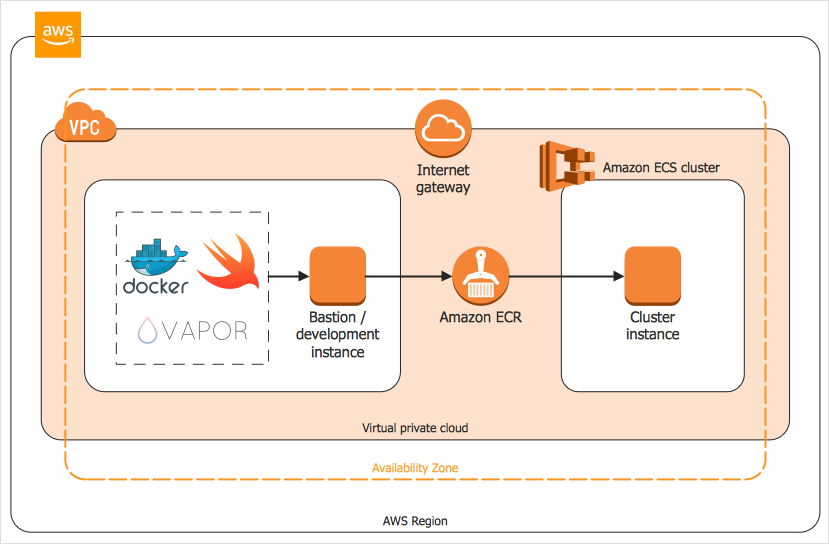
"A web application or web app is any application software that runs in a web browser or is created in a browser-supported programming language (such as the combination of JavaScript, HTML and CSS) and relies on a common web browser to render the application. ... Applications are usually broken into logical chunks called "tiers", where every tier is assigned a role. ...
For more complex applications, a 3-tier solution may fall short, and it may be beneficial to use an n-tiered approach, where the greatest benefit is breaking the business logic, which resides on the application tier, into a more fine-grained model. Another benefit may be adding an integration tier that separates the data tier from the rest of tiers by providing an easy-to-use interface to access the data. For example, the client data would be accessed by calling a "list_ clients()" function instead of making an SQL query directly against the client table on the database. This allows the underlying database to be replaced without making any change to the other tiers." [Web application. Wikipedia]
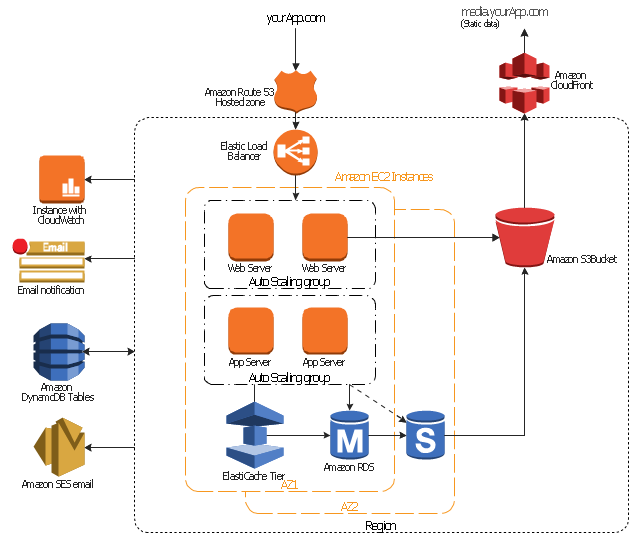
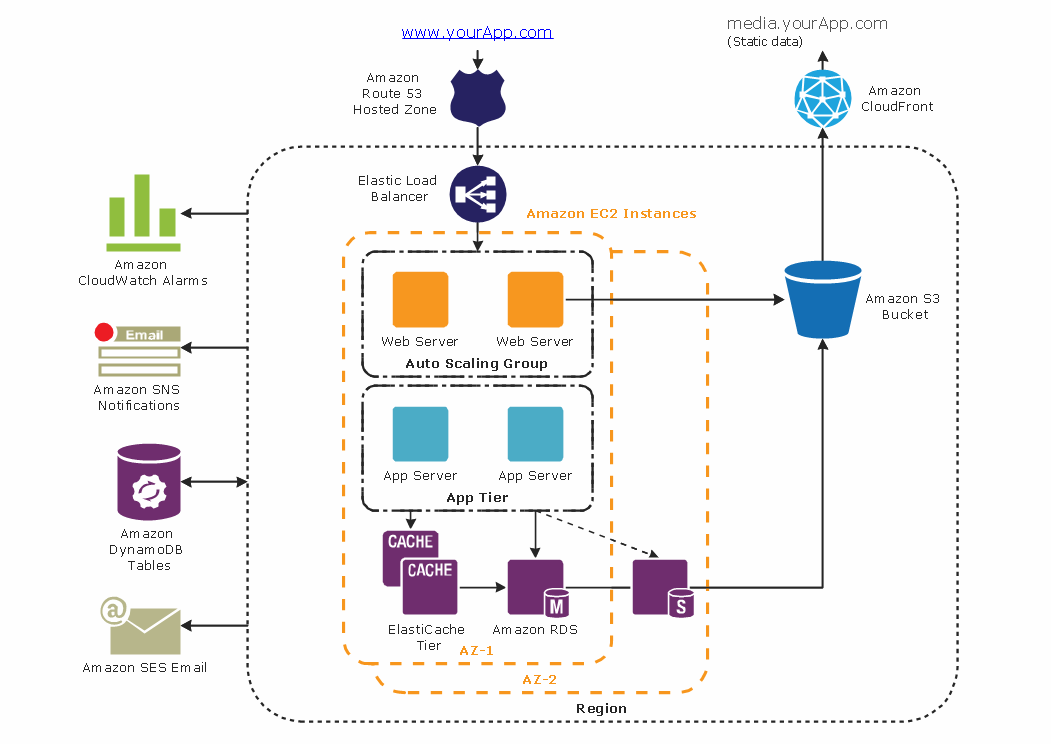
The AWS architecture diagram example "3-Tier Auto-scalable Web Application Architecture" was created using the ConceptDraw PRO diagramming and vector drawing software extended with the AWS Architecture Diagrams solution from the Computer and Networks area of ConceptDraw Solution Park.
For more complex applications, a 3-tier solution may fall short, and it may be beneficial to use an n-tiered approach, where the greatest benefit is breaking the business logic, which resides on the application tier, into a more fine-grained model. Another benefit may be adding an integration tier that separates the data tier from the rest of tiers by providing an easy-to-use interface to access the data. For example, the client data would be accessed by calling a "list_ clients()" function instead of making an SQL query directly against the client table on the database. This allows the underlying database to be replaced without making any change to the other tiers." [Web application. Wikipedia]
The AWS architecture diagram example "3-Tier Auto-scalable Web Application Architecture" was created using the ConceptDraw PRO diagramming and vector drawing software extended with the AWS Architecture Diagrams solution from the Computer and Networks area of ConceptDraw Solution Park.
AWS architecture diagram
Diagramming tool - Amazon Web Services and Cloud Computing Diagrams
 AWS Architecture Diagrams
AWS Architecture Diagrams with powerful drawing tools and numerous predesigned Amazon icons and AWS simple icons is the best for creation the AWS Architecture Diagrams, describing the use of Amazon Web Services or Amazon Cloud Services, their application for development and implementation the systems running on the AWS infrastructure. The multifarious samples give you the good understanding of AWS platform, its structure, services, resources and features, wide opportunities, advantages and benefits from their use; solution’s templates are essential and helpful when designing, description and implementing the AWS infrastructure-based systems. Use them in technical documentation, advertising and marketing materials, in specifications, presentation slides, whitepapers, datasheets, posters, etc.
Entity Relationship Diagram Examples


Gane Sarson Diagram

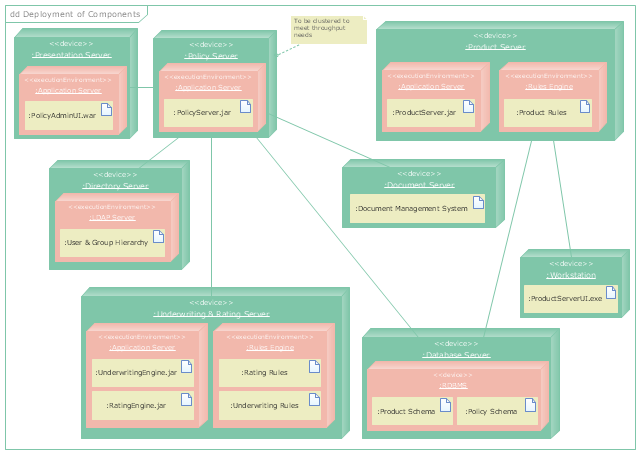
"A deployment diagram in the Unified Modeling Language models the physical deployment of artifacts on nodes. To describe a web site, for example, a deployment diagram would show what hardware components ("nodes") exist (e.g., a web server, an application server, and a database server), what software components ("artifacts") run on each node (e.g., web application, database), and how the different pieces are connected (e.g. JDBC, REST, RMI)." [Deployment diagram. Wikipedia]
This UML deployment diagram example was created using the ConceptDraw PRO diagramming and vector drawing software extended with the Rapid UML solution from the Software Development area of ConceptDraw Solution Park.
This UML deployment diagram example was created using the ConceptDraw PRO diagramming and vector drawing software extended with the Rapid UML solution from the Software Development area of ConceptDraw Solution Park.
UML deployment diagram
The vector stencils library "Bank UML deployment diagram" contains 10 shapes for drawing UML deployment diagrams.
Use it for object-oriented modeling of your bank information system.
"A deployment diagram in the Unified Modeling Language models the physical deployment of artifacts on nodes. To describe a web site, for example, a deployment diagram would show what hardware components ("nodes") exist (e.g., a web server, an application server, and a database server), what software components ("artifacts") run on each node (e.g., web application, database), and how the different pieces are connected (e.g. JDBC, REST, RMI).
The nodes appear as boxes, and the artifacts allocated to each node appear as rectangles within the boxes. Nodes may have subnodes, which appear as nested boxes. A single node in a deployment diagram may conceptually represent multiple physical nodes, such as a cluster of database servers.
There are two types of Nodes:
1. Device Node.
2. Execution Environment Node.
Device nodes are physical computing resources with processing memory and services to execute software, such as typical computers or mobile phones. An execution environment node (EEN) is a software computing resource that runs within an outer node and which itself provides a service to host and execute other executable software elements." [Deployment diagram. Wikipedia]
This example of UML deployment diagram symbols for the ConceptDraw PRO diagramming and vector drawing software is included in the ATM UML Diagrams solution from the Software Development area of ConceptDraw Solution Park.
UML deployment diagram symbols

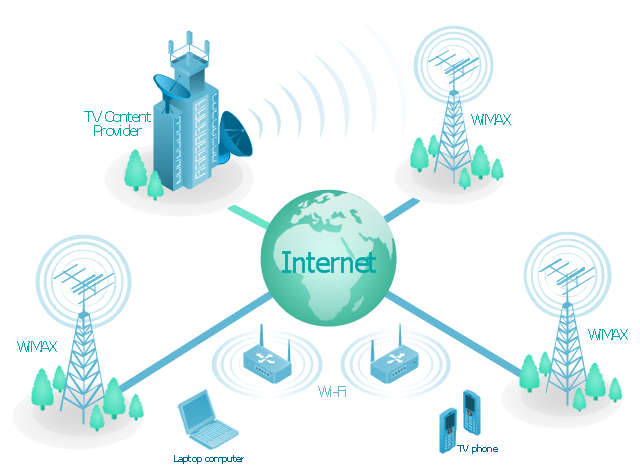
"Mobile IPTV is a technology that enables users to transmit and receive multimedia traffic including television signal, video, audio, text and graphic services through IP-based the wired and wireless networks with support for Quality of Service/ QoE, security, mobility, and interactive functions. Through Mobile IPTV, users can enjoy IPTV services anywhere and even while on the move." [Mobile IPTV. Wikipedia]
This mobile web-based TV network diagram example was created using the ConceptDraw PRO diagramming and vector drawing software extended with the Telecommunication Network Diagrams solution from the Computer and Networks area of ConceptDraw Solution Park.
This mobile web-based TV network diagram example was created using the ConceptDraw PRO diagramming and vector drawing software extended with the Telecommunication Network Diagrams solution from the Computer and Networks area of ConceptDraw Solution Park.
Mobile IP-based TV diagram
HelpDesk
How to Create an AWS Architecture Diagram
- Meaning Of Web Diagram
- The Block Diagram On How To Make A Web Page
- How To create Diagrams for Amazon Web Services architecture ...
- How To create Diagrams for Amazon Web Services architecture ...
- Mobile TV Web -based network diagram | CCTV Network Diagram ...
- How to Save a Diagram as a Web Page in ConceptDraw PRO ...
- UML Deployment Diagram . Design Elements
- 3-Tier Auto-scalable Web Application Architecture | Amazon Web ...
- Web Application Component Diagram
- Website Design Flowchart Example
- Network Architecture Diagram For A Web
- Example Of A Web Hosting Architecture Diagram
- Amazon Web Services Diagrams diagramming tool for architecture ...
- Diagramming tool - Amazon Web Services and Cloud Computing ...
- 3-Tier Auto-scalable Web Application Architecture | AWS ...
- Amazon Web Services | Martin ERD Diagram | Telecommunication ...
- AWS Architecture Diagrams | Diagramming tool - Amazon Web ...
- Examples Of Web Server Diagram
- Website Diagram