HelpDesk
How to Draw a Pyramid Diagram

Pyramid Diagram and Pyramid Chart

How to Create a Pyramid Diagram

Pyramid Chart Examples

Pyramid Chart Maker

A five level pyramid model of different types of Information Systems based on the information processing requirement of different levels in the organization. The first level represents transaction processing systems to process basic data. The second level represents office support systems to process information in office. The third level represents management information systems to process information by managers. The fourth level represents decision support systems to process explicit knowledge. The fifth level represents executive information systems to process tacit knowledge.
"A Computer(-Based) Information System is essentially an IS using computer technology to carry out some or all of its planned tasks. The basic components of computer based information system are:
(1) Hardware - these are the devices like the monitor, processor, printer and keyboard, all of which work together to accept, process, show data and information.
(2) Software - are the programs that allow the hardware to process the data.
(3) Databases - are the gathering of associated files or tables containing related data.
(4) Networks - are a connecting system that allows diverse computers to distribute resources.
(5) Procedures - are the commands for combining the components above to process information and produce the preferred output.
The first four components (hardware, software, database and network) make up what is known as the information technology platform. Information technology workers could then use these components to create information systems that watch over safety measures, risk and the management of data. These actions are known as information technology services." [Information systems. Wikipedia]
This pyramid diagram was redesigned using the ConceptDraw PRO diagramming and vector drawing software from Wikimedia Commons file Five-Level-Pyramid-model.png. [commons.wikimedia.org/ wiki/ File:Five-Level-Pyramid-model.png]
This file is licensed under the Creative Commons Attribution 3.0 Unported license. [creativecommons.org/ licenses/ by/ 3.0/ deed.en]
The triangle chart example "Information systems types" is included in the Pyramid Diagrams solution from the Marketing area of ConceptDraw Solution Park.
Pyramid diagram

How To Make Histogram in ConceptDraw DIAGRAM ?

How To Make a Histogram?

HelpDesk
How to Draw a Circular Arrows Diagram

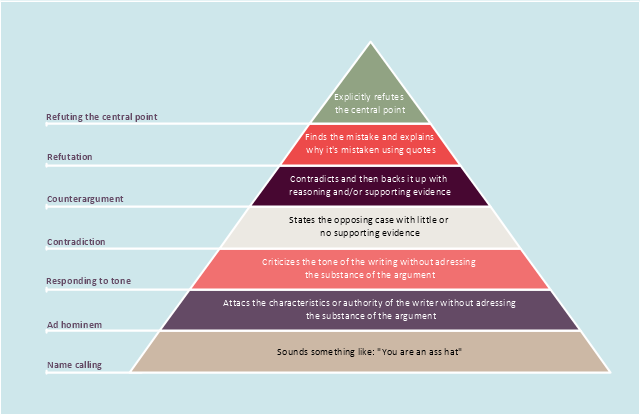
"Graham proposed a "disagreement hierarchy" in a 2008 essay "How to Disagree", putting types of argument into a seven-point hierarchy and observing that "If moving up the disagreement hierarchy makes people less mean, that will make most of them happier."
Although originally written as a simple list, Graham's hierarchy can be represented as a pyramid with the most convincing form of disagreement at the top, and the weakest at the bottom.
Graham notes that articulate forms of name-calling ("The author is a self-important dilettante.") are no different from crude insults, in this hierarchy." [Paul Graham (computer programmer). Wikipedia]
The pyramid diagram example "Graham's hierarchy of disagreement" was redesigned using the ConceptDraw PRO diagramming and vector drawing software from Wikimedia Commons file Graham's Hierarchy of Disagreement.svg. [commons.wikimedia.org/ wiki/ File:Graham's Hierarchy of Disagreement.svg]
The triangle chart example "Graham's hierarchy of disagreement" is included in the Pyramid Diagrams solution from the Marketing area of ConceptDraw Solution Park.
Pyramid diagram
 ConceptDraw Solution Park
ConceptDraw Solution Park collects graphic extensions, examples and learning materials
 25 Typical Orgcharts
The 25 Typical Orgcharts solution contains powerful organizational structure and organizational management drawing tools, a variety of professionally designed organization chart and matrix organization structure samples, 25 templates based on various orga
Pie Donut Chart. Pie Chart Examples

How Do You Make a Histogram?

- Pyramid Diagram and Pyramid Chart | Pyramid Diagram | How to ...
- Marketing Diagrams | Marketing Charts | Marketing Organization ...
- Pyramid Diagram and Pyramid Chart | Energy Pyramid Diagram ...
- How to Make an Ansoff Matrix Template in ConceptDraw PRO ...
- How to Draw an Organization Chart | Organizational Structure ...
- Pyramid Chart Examples | How to Make SWOT Analysis in a Word ...
- Pyramid diagram - Template | Pyramid Diagram and Pyramid Chart ...
- Pyramid Charts | Pyramid Diagram and Pyramid Chart | How to ...
- ConceptDraw Solution Park | Pyramid Chart Examples | Process ...
- Process Flowchart | Pyramid Chart Examples | How to Draw an ...
- Pyramid Diagram and Pyramid Chart | Pyramid Chart Maker ...
- Pyramid Diagram | 5 Level pyramid model diagram - Information ...
- How to Make a Mind Map from a Project Gantt Chart | Pyramid Chart ...
- Pyramid Charts | Pyramid Chart Examples | Energy Pyramid ...
- Target and Circular Diagrams | Marketing | Pyramid Diagram and ...
- Pyramid Diagram and Pyramid Chart | How to Draw a Pyramid ...
- Pyramid Diagram | Pyramid Diagram | 4 Level pyramid model ...
- Pyramid Diagram | 3D Triangle diagram - Template | How to Draw a ...
- Marketing plan - Circular diagram | Pyramid Chart Examples | HVAC ...
- Triangle chart - Template | Pyramid diagrams - Vector stencils library ...