This site uses cookies. By continuing to browse the ConceptDraw site you are agreeing to our Use of Site Cookies.

Process Flowchart

ConceptDraw is Professional business process mapping software for making process flow diagram, workflow diagram, general flowcharts and technical illustrations for business documents. It is includes rich examples, templates, process flowchart symbols. ConceptDraw flowchart maker allows you to easier create a process flowchart. Use a variety of drawing tools, smart connectors, flowchart symbols and shape libraries to create flowcharts of complex processes, process flow diagrams, procedures and information exchange.
How To Create a Process Flow Chart (business process modelling techniques)
HelpDesk

How to Make a Basketball Court Diagram

Basketball Court diagrams is often used as a teaching and learning tool for coaches, players and parents to describe the basketball moves and shooting drills. The ability to create Basketball diagrams with ConceptDraw PRO is contained in the Basketball solution. It provides a set of special tools for creating different Basketball diagrams. Basketball court diagram is used to describe basketball moves and shooting drills during the discussion of the match, as well as to develop a winning defense and attack strategy as a clear visual plans for future games.
HelpDesk

How to Make Soccer Position Diagram Using ConceptDraw PRO

The soccer field has the form of a large rectangle, covered with grass. Dimensions of soccer fields may vary slightly, depending on the level of the game, but all fields have some common characteristics. Soccer players may take different positions. Each soccer position has its own name, and implies certain player functions. Every soccer position has a very specific name and task: Goalkeeper, Defenders, Midfielders and Forwards. During preparation for the game coach met a challenge: how to explain each player's position and his role in the game. The difficulty is the fact that in the course of the game players will often move on the field and do not stay in one place. Football field diagram with dimensions and marking, and positions - it is an important tool for the coach. ConceptDraw PRO helps both coach and players to understand exactly their roles during the particular game. The ability to create Soccer diagrams is contained in the ConceptDraw Soccer solution. The solution provides
HelpDesk

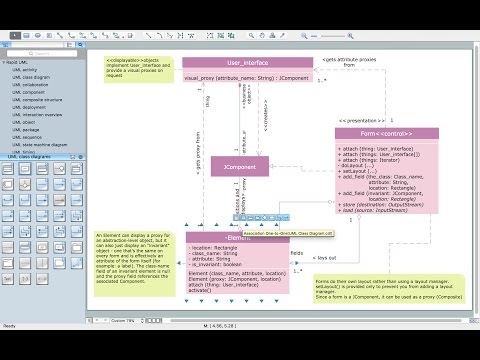
How to Make a UML Diagram in ConceptDraw PRO

The Unified Modeling Language™(UML) is a standard visual modeling language to document business processes and software architecture. UML uses several types of diagrams including Use Case Diagrams, Class, Package, Component, Composite Structure Diagrams, Deployments, Activities and Interactions. The accepted standard used when modeling a system is known as Unified Modeling Language (UML), a generic set of notations that are used when creating UML diagrams. These notations can visually represent requirements, subsystems, logical and physical elements, and structural and behavioral patterns, that are especially relevant to systems built using an object-oriented style.
Using UML during the modeling process has a number of benefits — for one, the entire development team can share information and collaborate using common language, diagrams and software, something that's not possible when using a more task-specific programming language.
It allows team members to create system 'blueprin
HelpDesk

How to Make Network Diagram

ConceptDraw PRO allows you to represent and communicate network architecture, topology, and design to engineers, stakeholders and end-users.
HelpDesk

How to Create a Hook Up Diagram

Hook-up diagram of audio-video system is a detailed drawing showing the audio video connections in a correct manner so that system operates properly. Using the hook up diagram you can understand how the elements of your audio-video system should be installed. ConceptDraw PRO allows you to draw the Hook Up diagram of Audio-Video system easily using the set of special libraries provided by Audio and Video Connectors solution.

How To Create Professional Diagrams

No need for any special drawing skills to create professional looking diagrams outside of your knowledge base. ConceptDraw PRO takes care of the technical side.

Use templates, samples and special libraries for your needs.
HelpDesk

How to Create an IDEF0 Diagram for an Application Development

IDEF0 methods are intended to model the functions of a process, creating a graphical model that displays: what controls the function, who makes it, what resources are used and how they are connected with other functions. The IDEF0 tool is used to model the decisions, actions, and activities of a software system during the development process . IDEF0 diagram graphically depicts a model of a desired version of the application. ConceptDraw PRO allows you to create and communicate the IDEF0 diagrams of any complexity.

How To Make a Bubble Chart

Bubble diagrams solution extends ConceptDraw PRO software with templates, Using ConceptDraw Connectors, you can make a bubble chart in moments. Using ConceptDraw you will be able to make a bubble chart from the ready ConceptDraw library objects or make your own objects. The created diagram can represent ideas organization, in brainstorming processes, by teachers for explaining difficult ideas or for presentations.
HelpDesk

How to Add a Block Diagram to a PowerPoint Presentation

Block diagram is rather universal type of charts - compositions from geometric blocks can be applied to describe various kinds of processes or systems, consisting from components, which depend on each other. Block diagrams are indispensable when you need to represent a process or system on a basic level. With blocks, you can easily depict the basic elements of the process, without drilling down. The PowerPoint presentation of major process steps and key process participants can be very informative and helpful. Using ConceptDraw PRO, you can easily convert a block diagram to MS PowerPoint presentation.
HelpDesk

How to Create a Timeline Diagram in ConceptDraw PRO

A Timeline is a chart which displays a project plan schedule in chronological order. A Timeline is used in project management to depict project milestones and visualize project phases, and show project progress. The graphic form of a timeline makes it easy to understand critical project milestones, such as the progress of a project schedule. Timelines are particularly useful for project scheduling or project management when accompanied with a Gantt chart. It captures the main of what the project will accomplish and how it will be done. making a project timeline is one of the most important skills a project manager needs have. Making comprehensive, accurate timelines allows you getting every project off in the best way. ConceptDraw PRO allows you to draw a timeline charts using special library.

Basic Diagramming

ConceptDraw PRO with the specific tools you need to easily draw flowcharts, block diagrams, bar charts, histograms, pie charts, divided bar diagrams, line graphs, area charts, scatter plots, circular arrows diagrams, Venn diagrams, bubble diagrams, concept maps, electrical circuit diagrams, schematics,and others.
Use Basic Diagramming solution to draw you own diagrams, charts and graphs for graphic communication, explanation of business and personal ideas and concepts, simple visual presentation of numerical data, complex structures, logical relations, step-by-step flows of actions or operations.
HelpDesk

How to Create Project Diagrams on Mac

Diagrams are very useful for project implementation because they help teams visualize important details such as interrelations between tasks, critical paths, timelines, milestones, calendars, and also resource usage.
HelpDesk

How to Draw a Circular Arrows Diagram Using ConceptDraw PRO

The cyclic recurrence is a fundamental property of multiple systems. The cycle is a process which consists from elements (phases, stages, stages) following each other. Many processes in astronomy, biology, chemistry, physics, mathematics, etc. have a cycle properties. It is also widely used in information technologies and marketing analysis. Graphical representation of cyclic processes can have many forms. It can be a circle, parabola, hyperbola, ellipse and others. A Circular Arrows Diagram is used as one of the statistical charts in the business, mass media and marketing. ConceptDraw PRO provides its users tools for making easy drawing Circular Arrows Diagrams.

UML Activity Diagram

UML Activity Diagram illustrates the business and operational step-by-step workflows of components in a system and shows the overall flow of control. You can use the appropriate stencils of UML notation from UML Activity library with 37 objects. ConceptDraw is ideal for software designers and software developers who need to draw UML Activity Diagrams.
Use ConceptDraw PRO diagramming and vector drawing software enhanced with Rapid UML solution from ConceptDraw Solution Park to create your own UML activity diagrams that show the business and operational workflows of components and overall flow of control in your systems. Such software provides coloring UML diagrams for various purposes and simplifying work of the engineers.