HelpDesk
How to Make PowerPoint Presentation of Data Driven Infographics

HelpDesk
How to Create Management Infographics

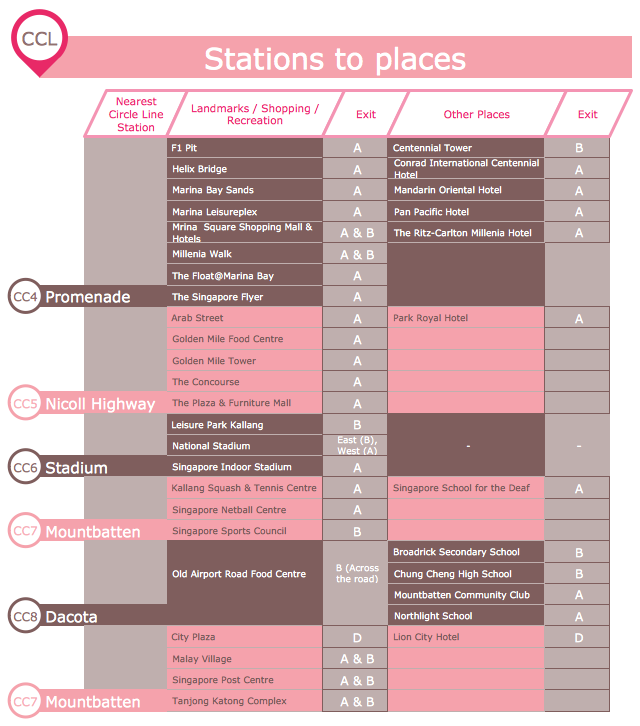
Transportation Infographics
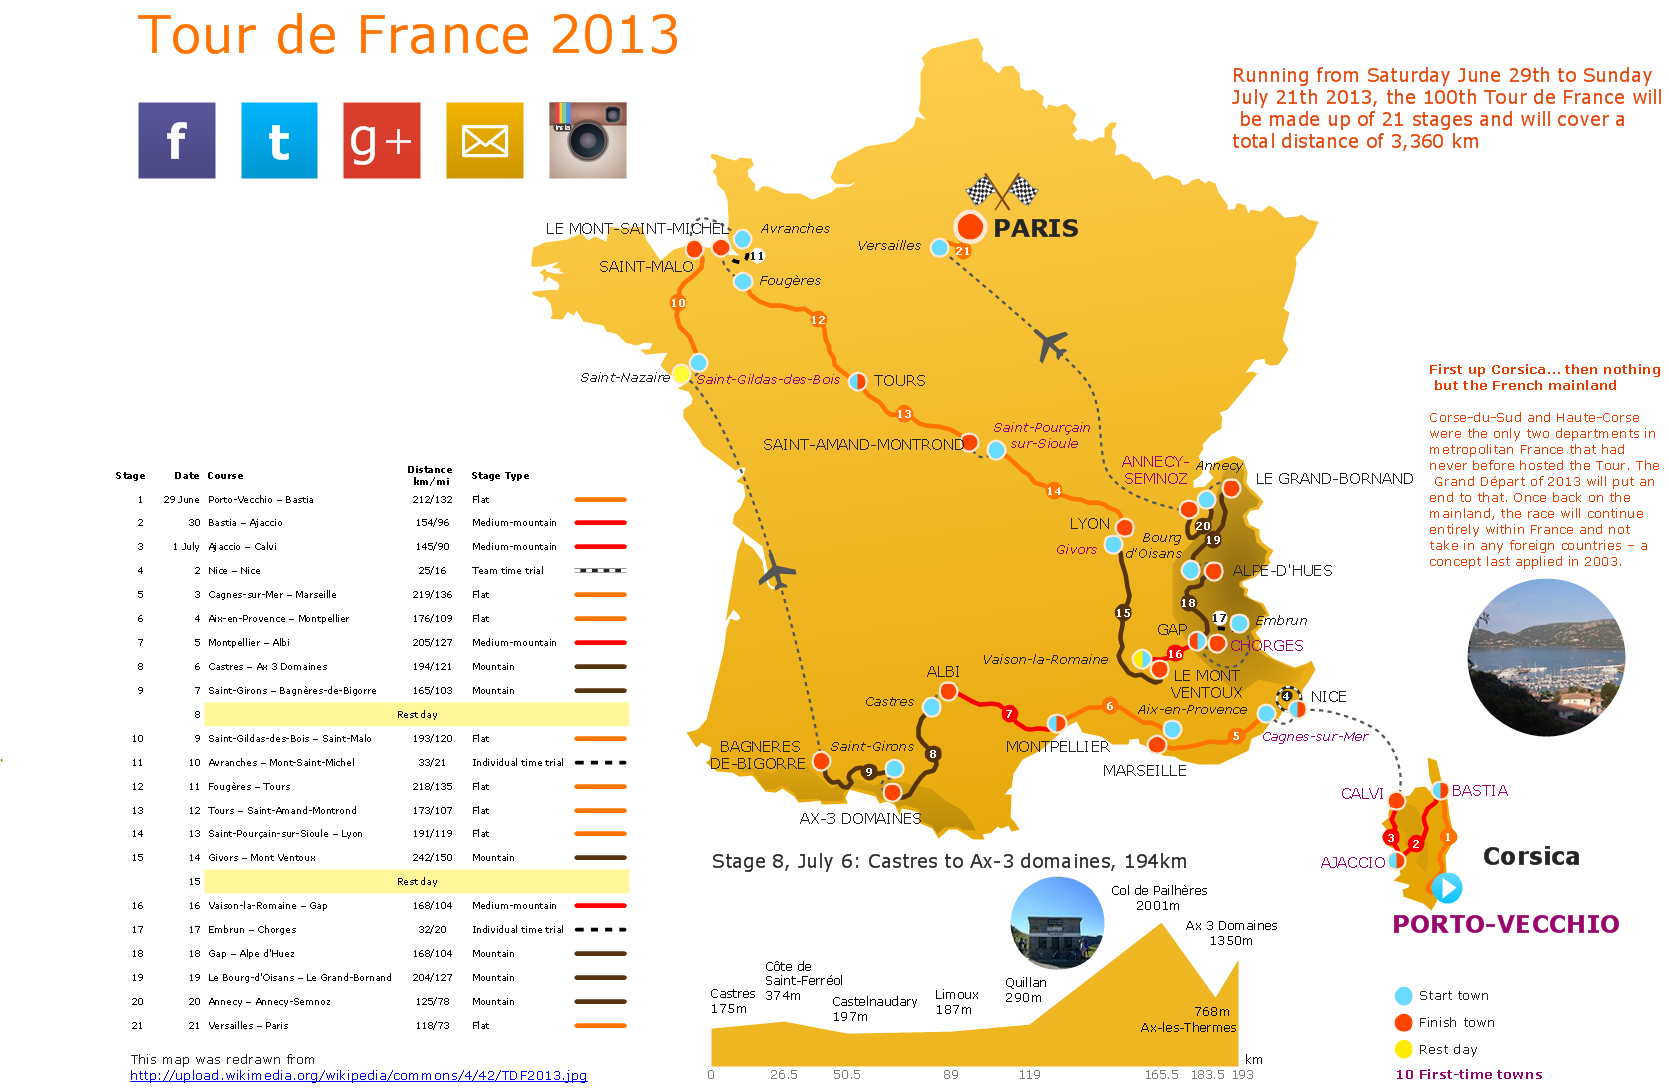
How to Make an Infographic
HelpDesk
How to Design Pharmacy Infographics

HelpDesk
How to Create Data-Driven Infographics

Best Tool for Infographic Construction

How to Create an Infographic
Make an Infographic

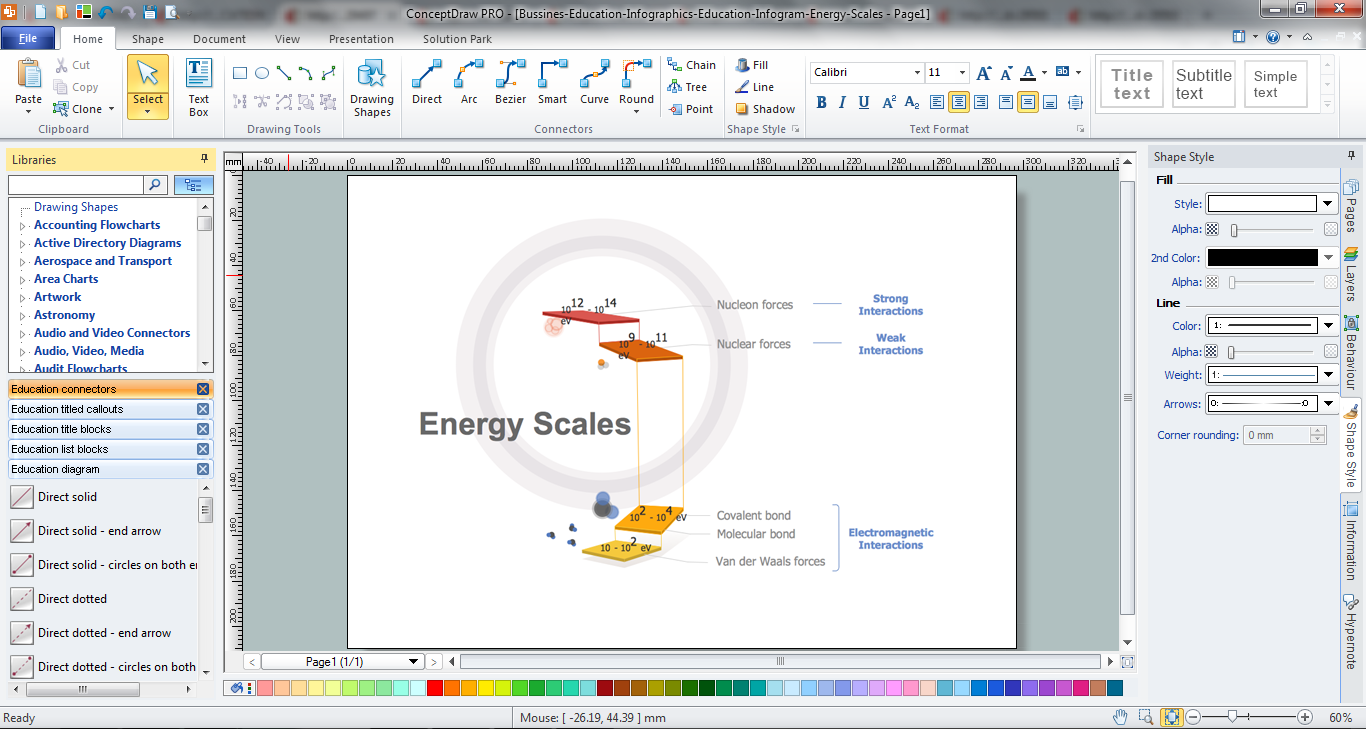
Education Infographics

- How to Create PowerPoint Presentation from Data Driven ...
- Metro Map | How to Make a Web Page from Your Metro Map ...
- How to Add a Bubble Diagram to a PowerPoint Presentation Using ...
- How to Create PowerPoint Presentation from Data Driven ...
- Metro Map | Best Tool for Infographic Construction | How to Create a ...
- Map Infographic Creator | Metro Map | Best Tool for Infographic ...
- Create Graph Ppt Online Free
- How to Create PowerPoint Presentation from Data Driven ...
- HVAC Marketing Plan | Create Captivating Presentations Easily ...
- Excellent Examples of Infographic Maps | Graphic User Interface ...