HelpDesk
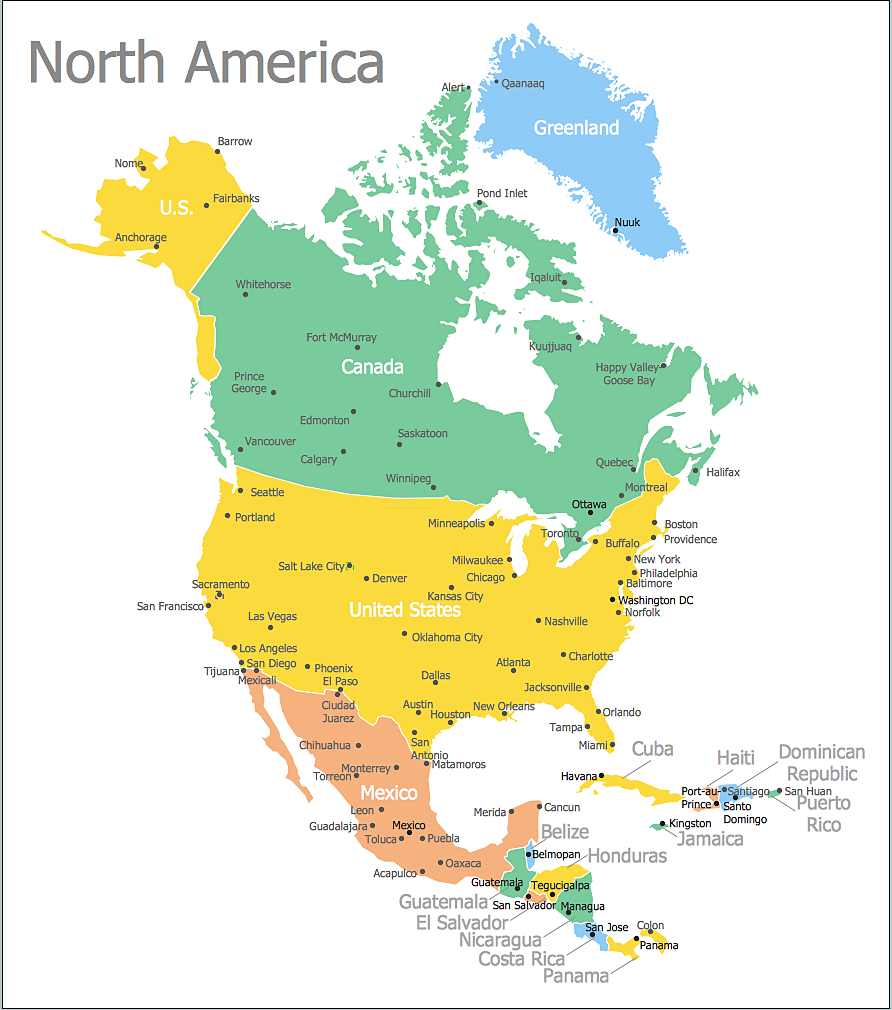
How to Draw a Map of North America Using ConceptDraw PRO
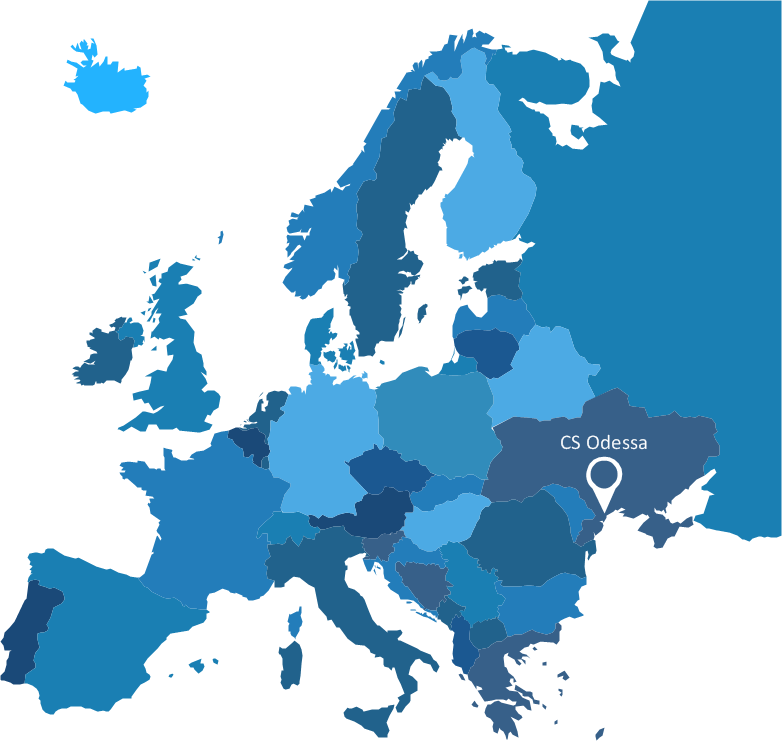
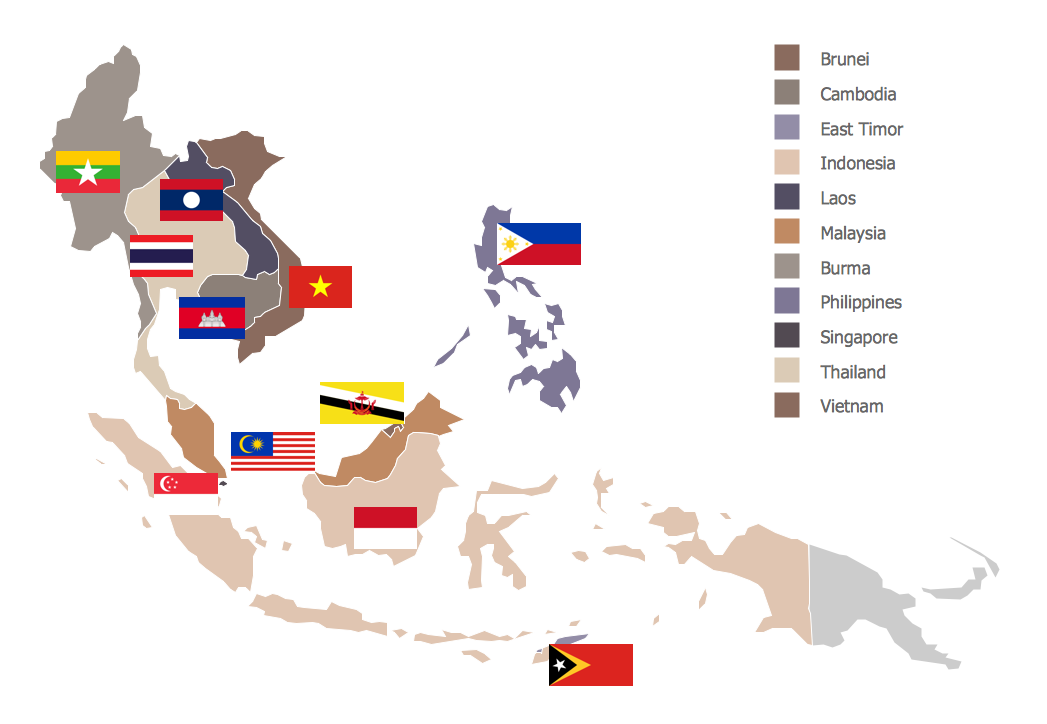
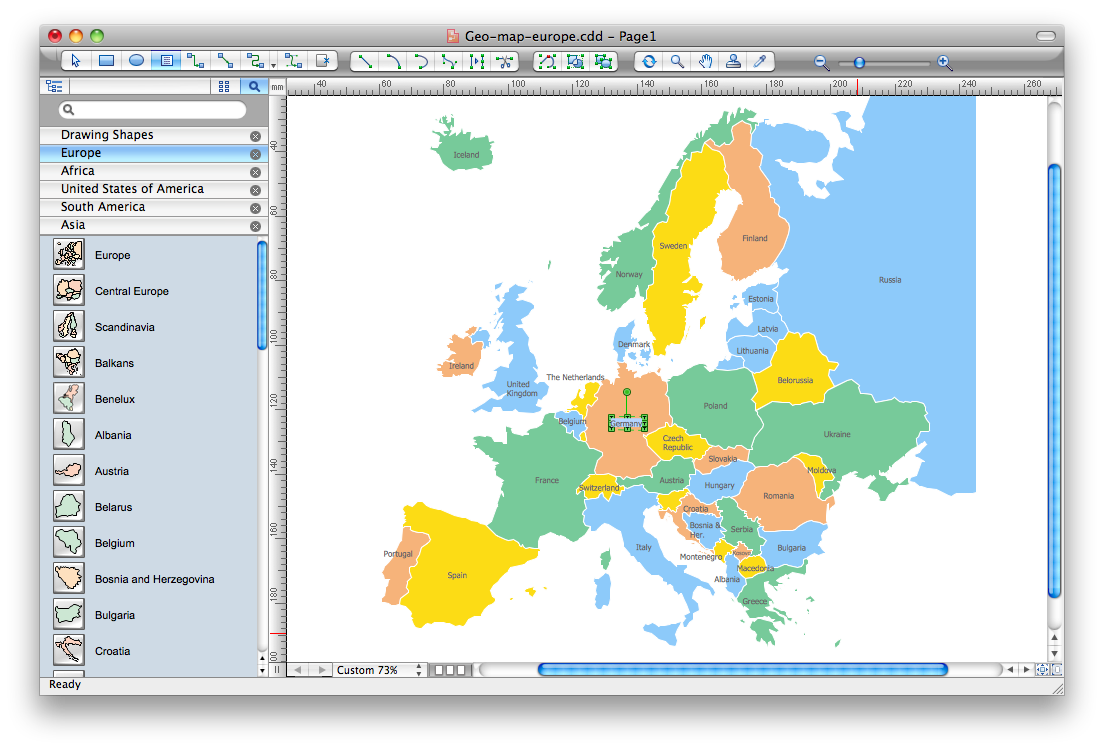
Geographic maps, cardiograms, and thematic maps are often used for geographical visualization of business information. Any country can inspire a wealth of geopolitical statistical data. A common way of assimilating this data is to create maps that convey a particular theme or subject matter in relation to a specific geographical area. Known as thematic maps, they cover themes such as population density, average rainfall, or political allegiance, differentiating the data by using graphical elements and annotation. Thematic maps contrast general reference maps, which tend to display information on a variety of subjects — vegetation, topology, roads and highways, for example. A thematic map will always focus on one particular subject matter. ConceptDraw PRO can be helpful as a tool for creating maps of countries and regions of the world. It allows you to draw continental maps quickly and easily using the special templates and vector stencils libraries.Spatial infographics Design Elements: Continental Map
ConceptDraw PRO is a software for making infographics illustrations. You can work with various components to build really impressive and easy-to-understand infographics design.Geospatial Data
Effective spatial infographics design, easy geospatial data presenting, now it is reality thanks to the extensive drawing tools of the Spatial Infographics Solution included in “What are Infographics” Area of ConceptDraw Solution Park.
 Maps
Maps
This solution extends ConceptDraw PRO v9.4 with the specific tools necessary to help you draw continental, directional, road, or transit maps, to represent international, business, or professional information visually.
 Spatial Infographics
Spatial infographics solution extends ConceptDraw PRO software with infographic samples, map templates and vector stencils libraries with design elements for drawing spatial information graphics.
Map Infographic Creator
Follow samples and map templates to create nfographic maps. It's super-easy!HelpDesk
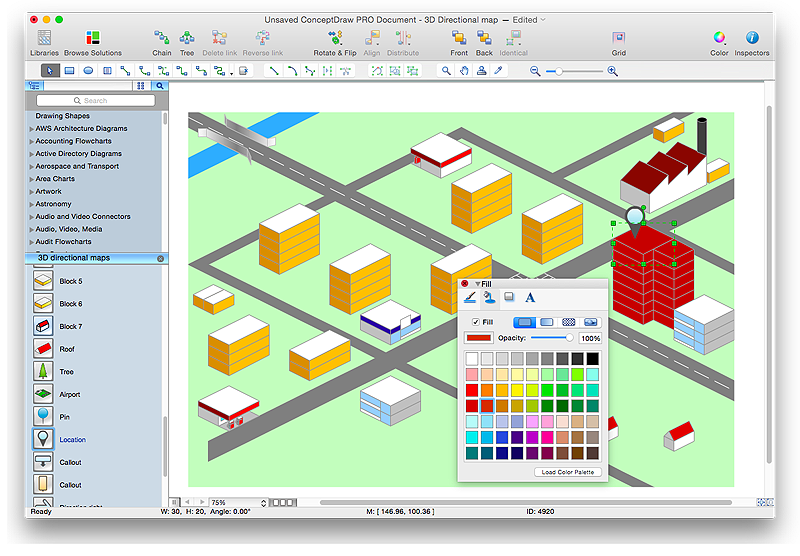
How to Create a Directional Map Using ConceptDraw PRO
Travelers often use directional maps to find directions for certain places. These maps are guide millions of tourists to explore towns and cities worldwide. Searching addresses on a map, view nearby businesses, get driving directions - this is only a little of what directional maps is needed. ConceptDraw PRO allows you to create various kinds of directional maps. You can easily visualize city maps or destinations with driving directions and traveler information using special vector stencils libraries.Geo Map - South America Continent
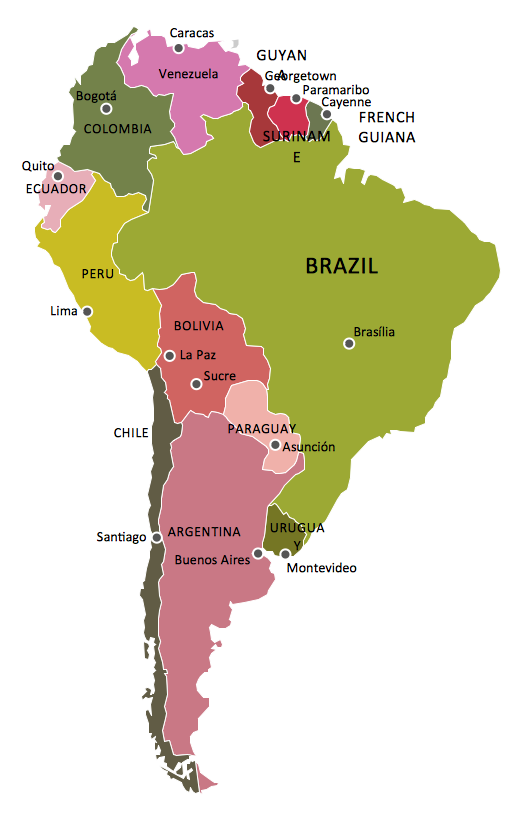
South America includes 12 sovereign states. ConceptDraw PRO is idea to draw the geological maps of South America continent from the pre-designed vector geo map shapes. Use Continent Maps solution from the Maps area of ConceptDraw Solution Park to draw thematic maps, geospatial infographics and vector illustrations for your business documents, presentations and websites.Tools to Create Your Own Infographics
Over the past few centuries, data visualization has evolved so much that we use it every day in all areas of our lives. Many believe that infographic is an effective tool of storytelling, as well as analytics, and that it is able to overcome most of the language and educational barriers. Understanding the mechanisms of human perception will help you to understand how abstract forms and colors used in data visualization can transmit information more efficient than long paragraphs of text.Visualization Spatial Data Using Thematic Maps Combined with Infographics
Now anyone can build an infographics from their data using ConceptDraw. Nice and simple, but the features it have are power-packed!Continents and Oceans Map
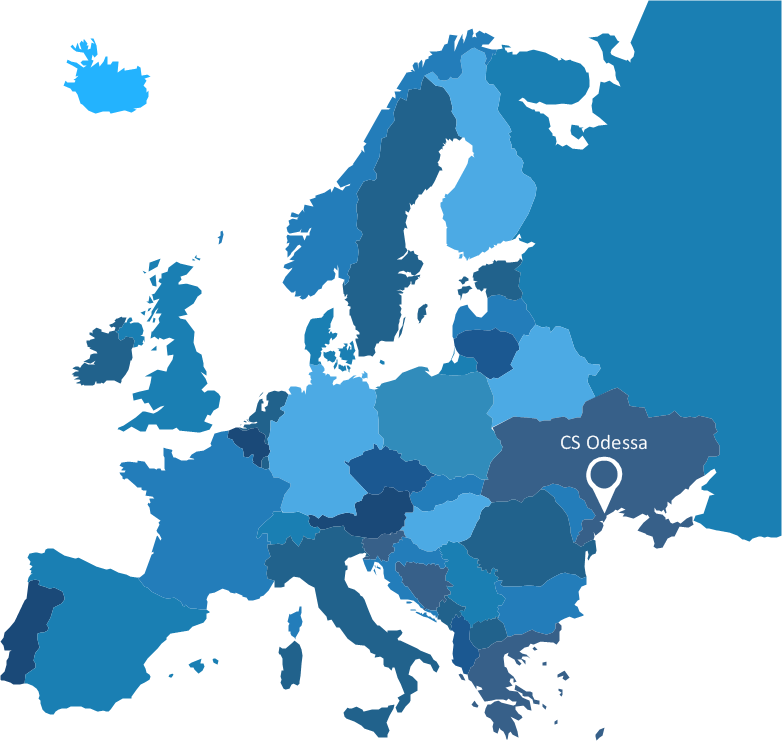
You need design a continent map, world continents map, continents and oceans map, or any other type of continent maps? Now, it's very easy thanks to the ConceptDraw PRO diagramming and vector drawing software supplied with Continent Maps Solution from the Maps Area of ConceptDraw Solution Park.How to draw Metro Map style infographics? (New York)
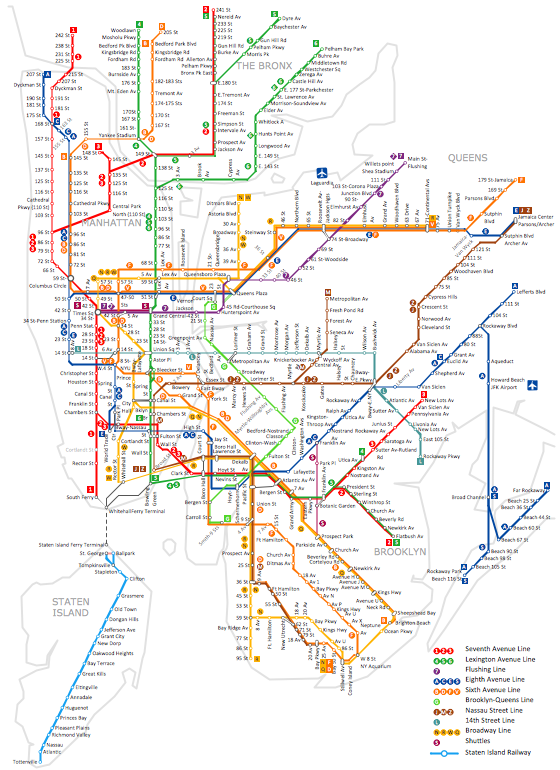
How to draw Metro Map style infographics of New York subway. New York Subway has a long history starting on October 27, 1904. Since the opening many agencies have provided schemes of the subway system. At present time are 34 lines in use. This page present New York City subway map construct with Metro Map Solution in Conceptdraw PRO software. This is a one-click tool to add stations to the map. It lets you control the direction in which you create new stations, change lengths, and add text labels and icons. It contains Lines, Stations, and Landmarks objectsGeo Map - Europe - United Kingdom
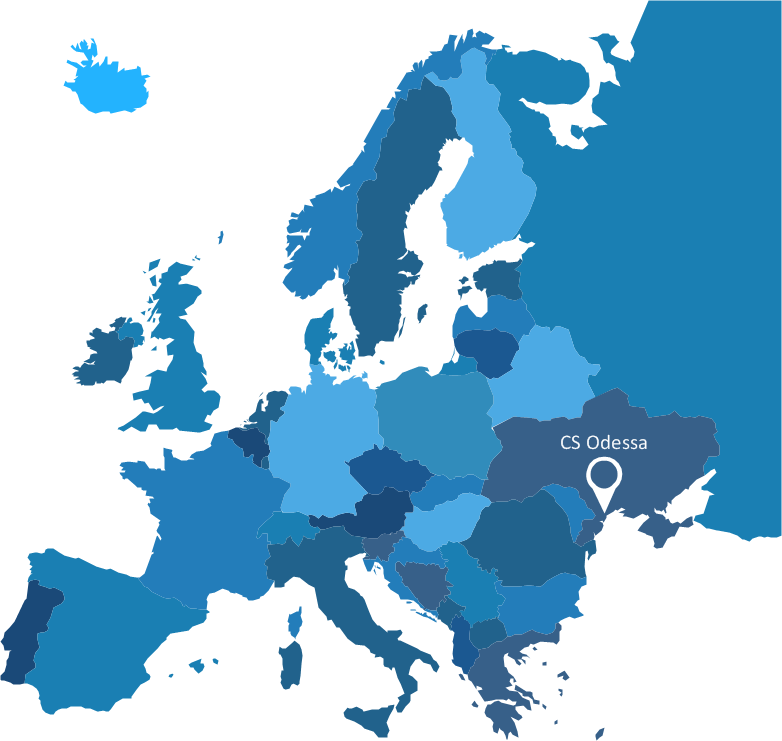
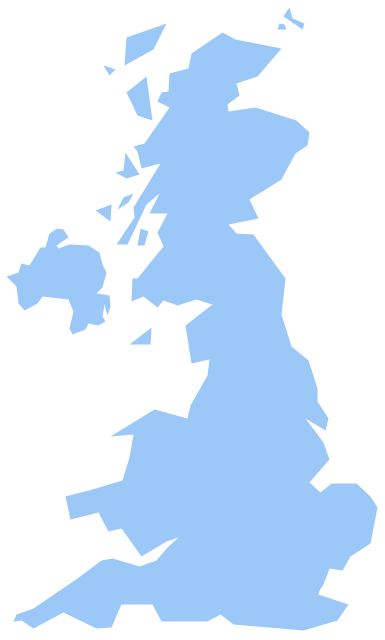
The vector stencils library United Kingdom contains contours for ConceptDraw PRO diagramming and vector drawing software. This library is contained in the Continent Maps solution from Maps area of ConceptDraw Solution Park.Map of USA
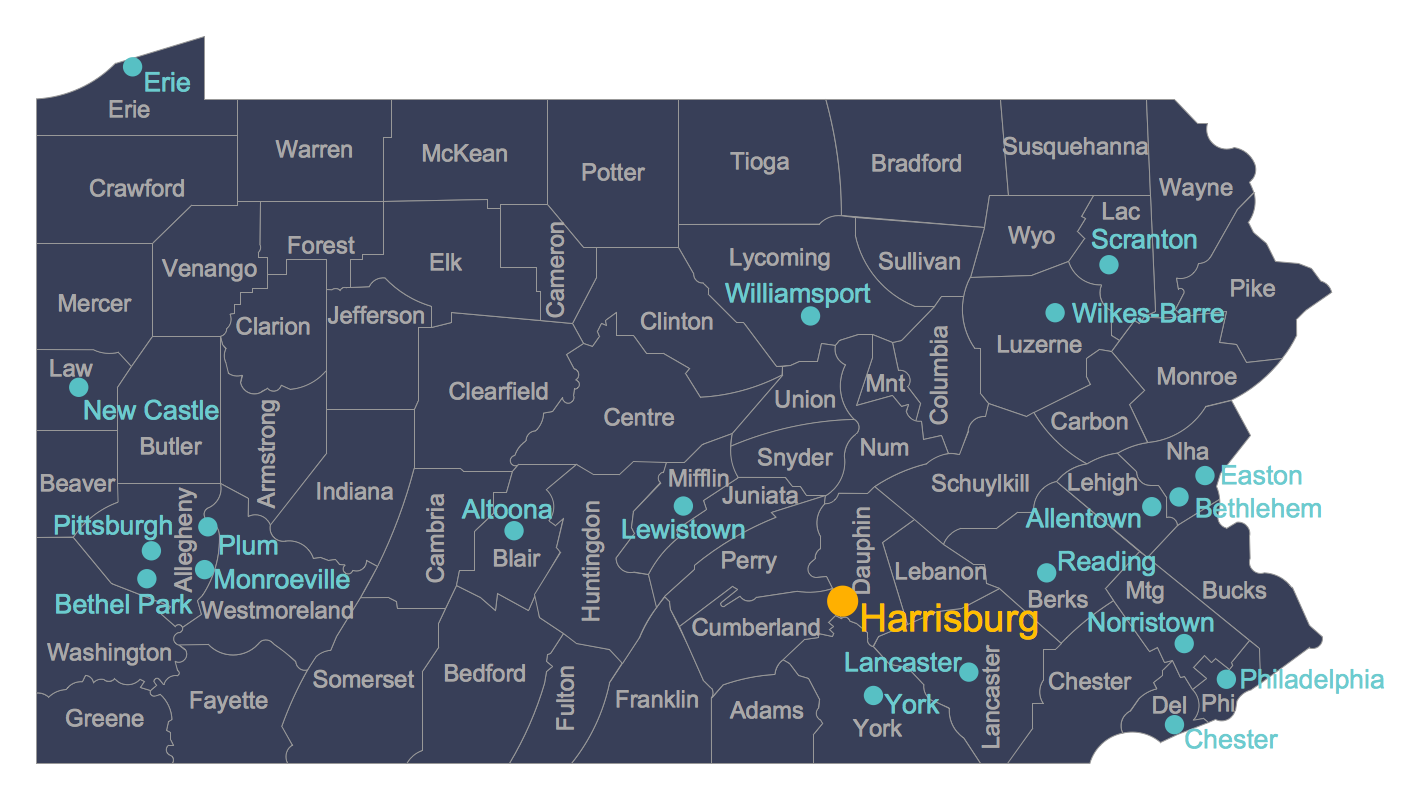
It is impossible to imagine modern life and science without maps, they surround us anywhere, they are used in geography, history, politics, economics, and many other fields of science. ConceptDraw PRO diagramming and vector drawing software offers the USA Maps Solution from the Maps Area of ConceptDraw Solution Park with its collection of samples and libraries for easy drawing the Map of USA.Map Software
Create maps, flags, and more with ConceptDraw- North America map with capitals - Template | How to Draw a Map of ...
- Continents Map | Spatial infographics Design Elements: Continental ...
- North America map with capitals - Template | Continents Map | How ...
- North America map - Template | North America map with capitals ...
- USA Maps | Map of USA | How to Draw a Map of North America ...
- Usa Map Template
- World Map Templates
- Value Stream Mapping Template | How to Start Mind Mapping from ...
- Spatial infographics Design Elements: Continental Map | Continents ...
- North America map with capitals - Template | South America map ...
- Spatial infographics Design Elements: Continental Map | Continent ...
- Directions Map | Map Directions | 2D Directional map - Template ...
- North America map - Template | Geo Map - South America Continent ...
- How to Draw a Mind Map on PC Using ConceptDraw MINDMAP ...
- North America map with capitals - Template
- North America - Vector stencils library | North America map ...
- The Seven Continents Templates
- How to Draw a Computer Network Diagrams | Network Layout Floor ...
- North America map with capitals - Template | Map of USA ...
- Continents Template
