HelpDesk
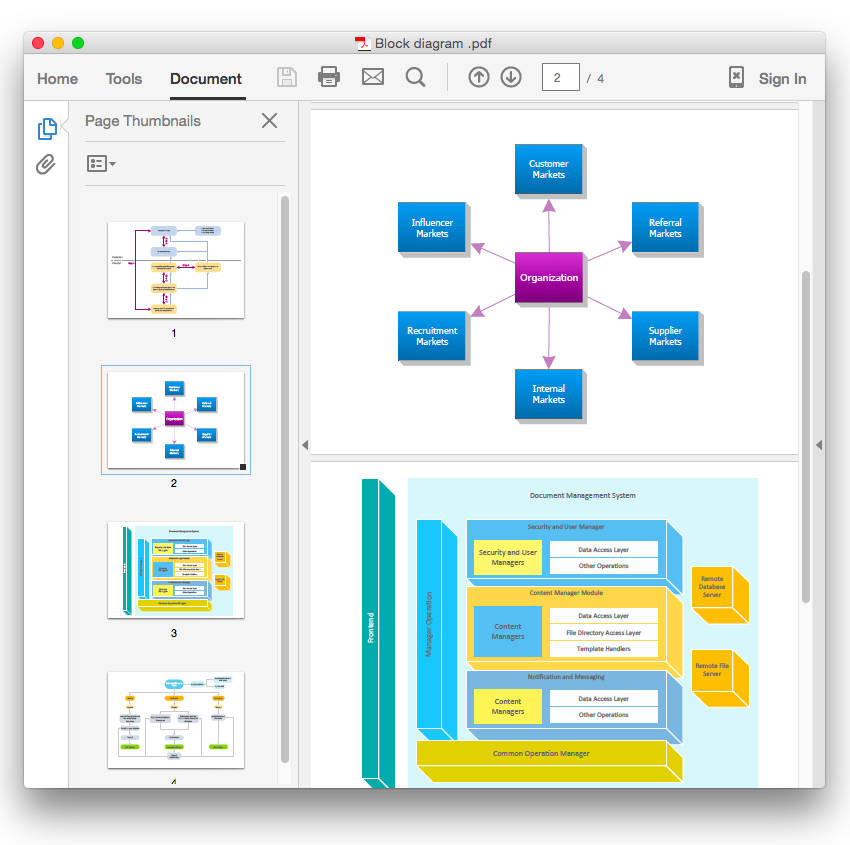
How To Convert a Block Diagram to Adobe PDF Using ConceptDraw PRO
ConceptDraw PRO allows you to easy share your business documentation between different computers with different operating systems and applications using it's export capabilities.You can get clear business graphic pack in pdf format and avoid any problems while communicating it with stakeholders.HelpDesk
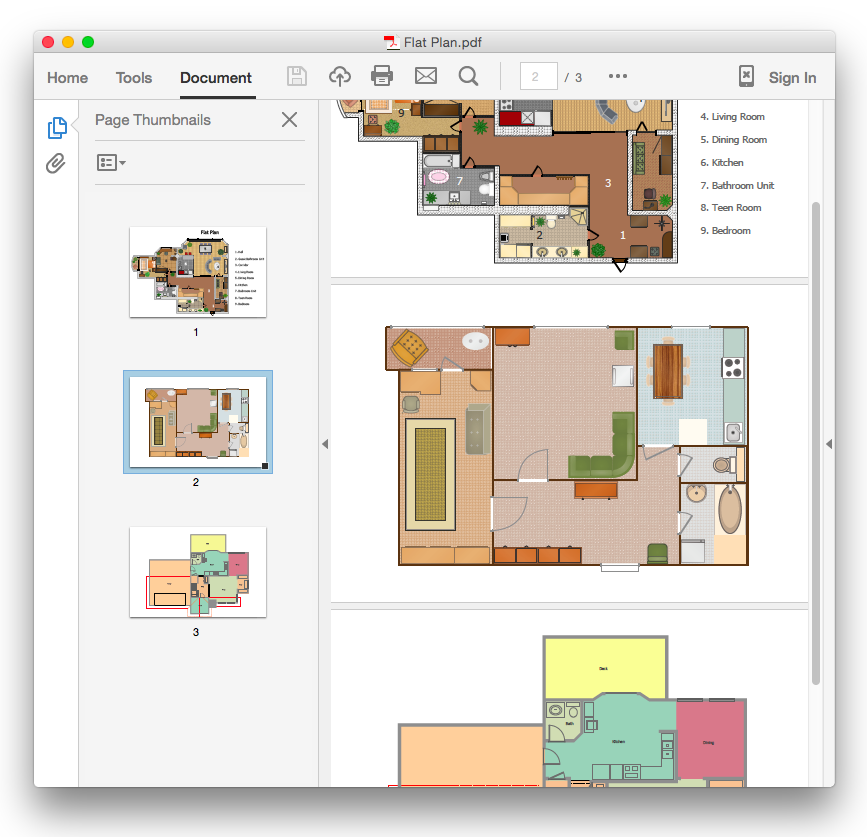
How To Convert a Floor Plan to Adobe PDF Using ConceptDraw PRO
ConceptDraw PRO allows you to easy share your building plans between different computers with different operating systems and applications using it's export capabilities.You can get clear floor plan in pdf format and avoid any problems while communicating it with your Customers and Contractors.HelpDesk
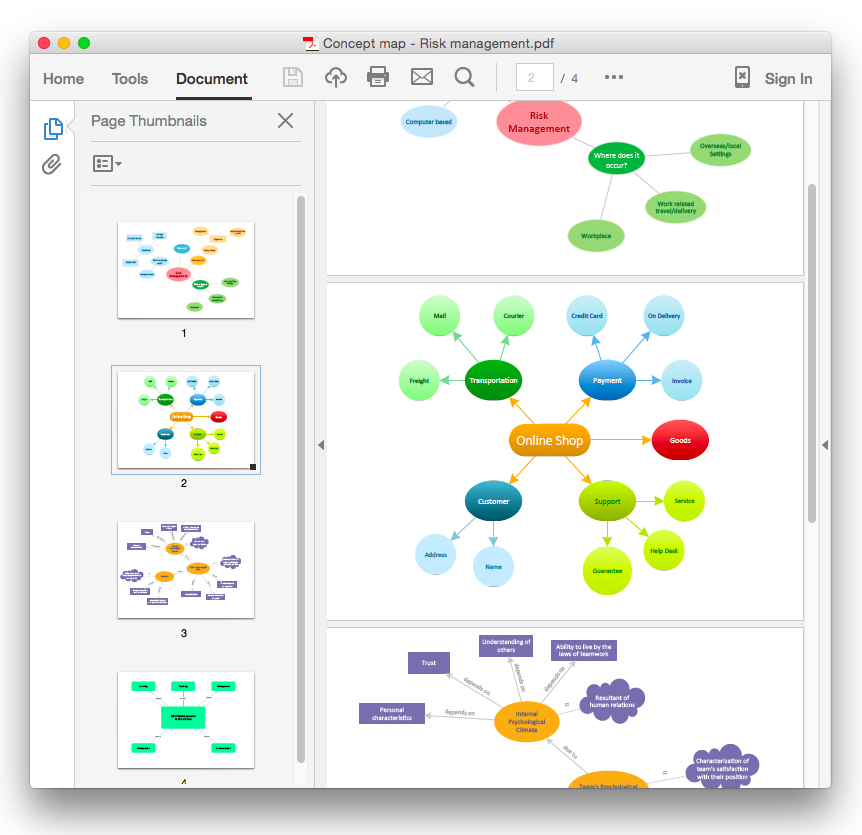
How To Convert a Concept Map to Adobe PDF Using ConceptDraw PRO
ConceptDraw PRO allows you to easy share your concept maps between different computers with different operating systems and applications using it's export capabilities.You can get clear business graphic pack in pdf format and easily communicate it with stakeholders.HelpDesk
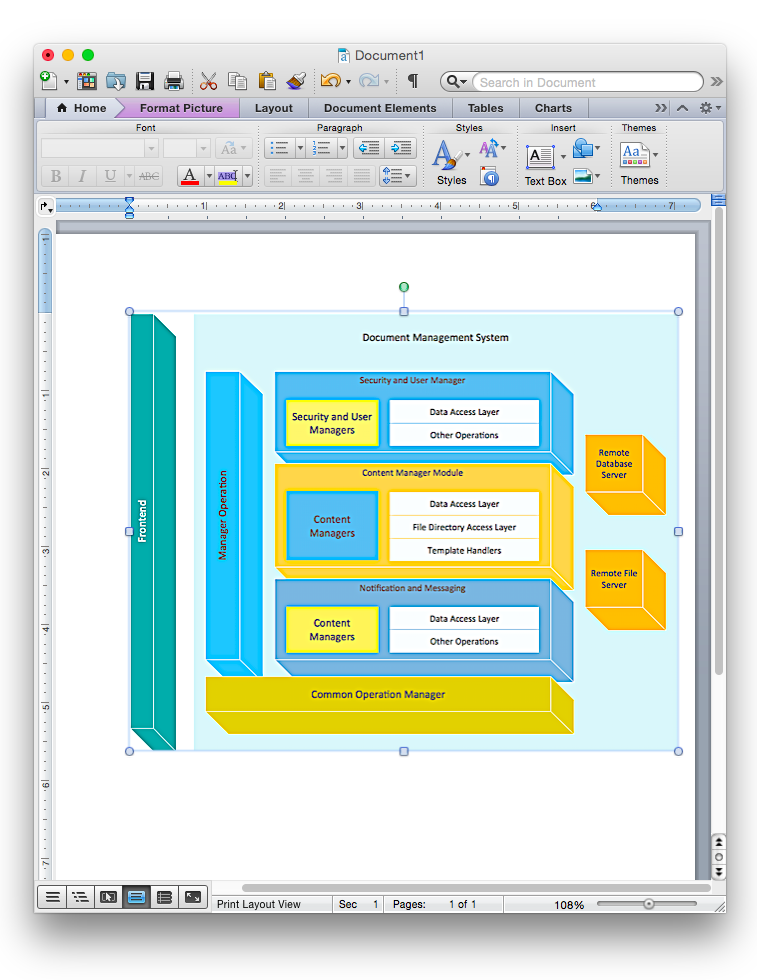
How to Add a Block Diagram to a MS Word ™ Document Using ConceptDraw PRO
Block diagram consists from graphic blocks. Blocks are connected by lines or arrows. Block diagrams are used to show the relationship between parts of some systems. It can be used for the development of new systems or to improve existing ones. The structure of block diagram gives a high-level overview of the major components of the system, as well as the important relationships. Using the block diagrams, you can more effectively present the business data contained in your MS Word documents. ConceptDraw PRO allows you to easily create block diagrams and then insert them into a MS Word document.HelpDesk
How to Draw a Block Diagram in ConceptDraw PRO
Block diagram is a simple chart that use blocks to show some elements or activities, and connectors that show the relationship between neighboring blocks. They are commonly simple, giving an overview of a process without necessarily going into the specifics of implementation. Block diagrams are commonly used to depict a general description of a system and its activity. A most known sample of a block diagram is a flow chart, used in many types of business as a common method of representing repeated processes. Easy and a simple creation, a number of objects and connectors make the block diagram a many-sided tool for various industries. The ability to make block diagrams is delivered by the ConceptDraw Block Diagrams solution.HelpDesk
How to Add a Block Diagram to a PowerPoint Presentation Using ConceptDraw PRO
A block diagram is a useful tool both in designing new processes, and in improving existing. A block diagram is a type of chart, which is often used in presentations, because of its universality - the graphic blocks can be applied to many processes.The PowerPoint presentation of major process steps and key process participants can be very informative and helpful. Using ConceptDraw PRO, you can easily convert a block diagram to MS PowerPoint presentation.HelpDesk
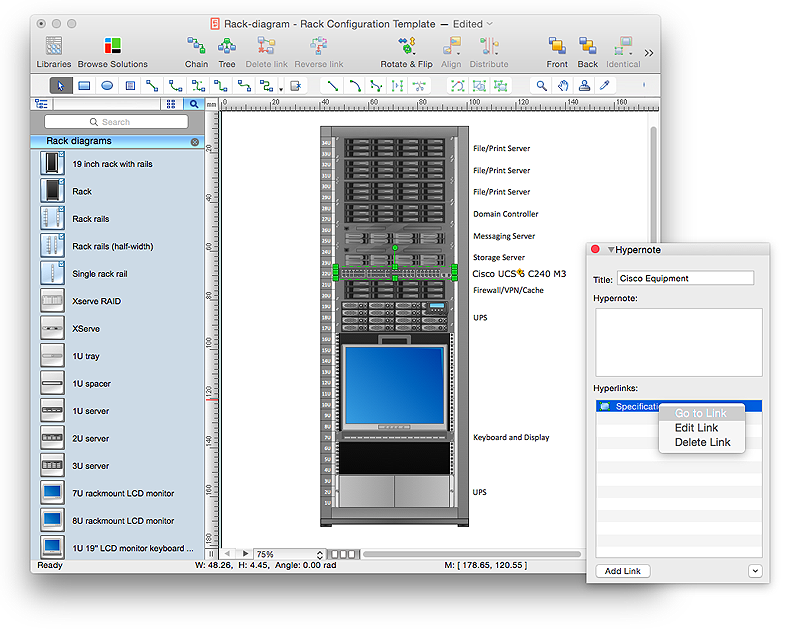
How to Create a Rack Diagram in ConceptDraw PRO
A Rack Diagram represents the rack mounting of network and computer equipment that is installed as a server. Rack diagrams are used by system administrators and network architectors when making a decision regarding the purchase of network equipment. It is used to show how a particular server configuration can be composed, without making its physical installation. ConceptDraw PRO enhanced with the Rack Diagrams Solution can be successfully used for making various rack diagrams. It's important that the solution used to create a rack diagram contains templates that stick to industry standards, and supplies a big selection of device icons to cover multiple types of equipment for a number of network configurations.HelpDesk
How to Create a Network Security Diagram Using ConceptDraw PRO
Network security requires constant work and attention to details. Each user, whether an individual or organization, owns an information, considered to be valuable. The enforcement of network security, whether it be a local network security, or wireless network security is core for creating the secure environment of the daily working processes. Network security is accomplished through hardware and software. Network security system must be sophisticated and modern inside, but simple and understandable for the user. The visual scheme of security system can be presented in the form of a Network Security diagram. ConceptDraw PRO provides the toolkit for network security system visualization with its Network Security Diagram solution.HelpDesk
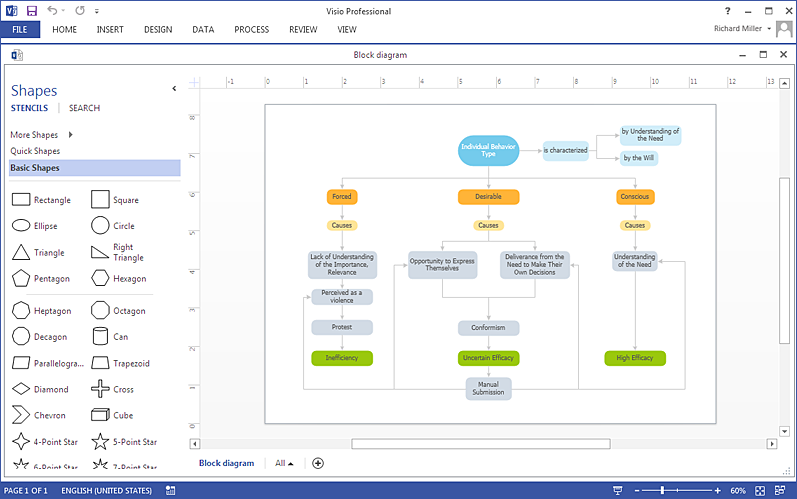
How To Create a MS Visio Block Diagram Using ConceptDraw PRO
ConceptDraw PRO allows you to easily create block diagrams of any complexity and then make a MS Visio file from your diagram in a single click.HelpDesk
How to Create Education Infographics
Education Infographics is used to display a lot of education-related information in a single, visually-appealing graphic. Infographics, created for education purposes can contain different illustrations, detailed charts, and data. ConceptDraw PRO can be used as a tool for creating education infographics. It allows you to draw infographics quickly and easily using the special templates and vector stencils libraries. Infographics can be used to quickly communicate a message, to simplify the presentation of large amounts of data, to see data patterns and relationships, and to monitor changes in variables over time. It can contain bar graphs, pie charts, histograms, line charts, e.t.c.HelpDesk
How to Create Management Infographics Using ConceptDraw PRO
Management might want to communicate a basic workflow for each division of the company, visualise business strategy and decision processes, or display a certain business training concept. In this case, an infographic can be more text heavy, and use illustrations to establish a timeline, process, or step-by-step sequence of events. ConceptDraw PRO can be used as a tool for creating management infographics. It allows you to draw infographics quickly and easily using the special templates and vector stencils libraries. Infographics can be used to quickly communicate a message, to simplify the presentation of large amounts of data, to see data patterns and relationships, and to monitor changes in variables over time. It can contain bar graphs, pie charts, histograms, line charts, e.t.c.HelpDesk
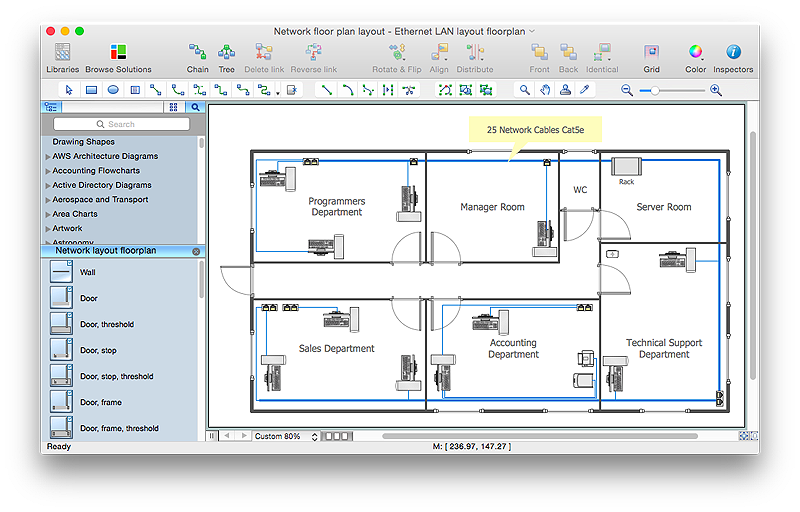
How to Create a Network Layout Floor Plan
With technology and market forces demanding ever quicker business response times, a well-structured computer network is the foundation of positive communication between employees, and with the wider world. When you walk into most modern work offices, there is a good chance you will be greeted by banks of computer screens and terminals, perhaps some sales points screens or server stacks, almost certainly routers and printers. A side effect of this amount of hardware is the amount of cabling necessary to connect these elements into an effective local area network (LAN). This is the idea behind a network layout plan - it can show how a network is connected, how data transfers between those connections, and give an overview of devices and hardware used in office. To create a practical computer network floor plan, the network administrator must adhere to the specified requirements and limitations of the office or building in which the LAN will operate - things such as hardware availability,HelpDesk
How to Draw a Chemical Process Flow Diagram
Process Flow Diagram widely used in modeling of processes in the chemical industry. A Chemical Process Flow diagram (PFD) is a specialized type of flowchart. With the help of Chemical Process Flow Diagram engineers can easily specify the general scheme of the processes and chemical plant equipment. Chemical Process Flow Diagram displays the real scheme of the chemical process, the relationship between the equipment and the technical characteristics of the process. Chemical Process Flow Diagram illustrates the connections between the basic equipment as well as the overall structure of pipelines and other supporting equipment. The purpose of the PFD is to build the image of the basic idea of the chemical process. ConceptDraw PRO together with its Chemical and Process Engineering solution delivers the possibility to design Chemical Process Flow diagrams. It is designed for chemical industry engineers and designers.HelpDesk
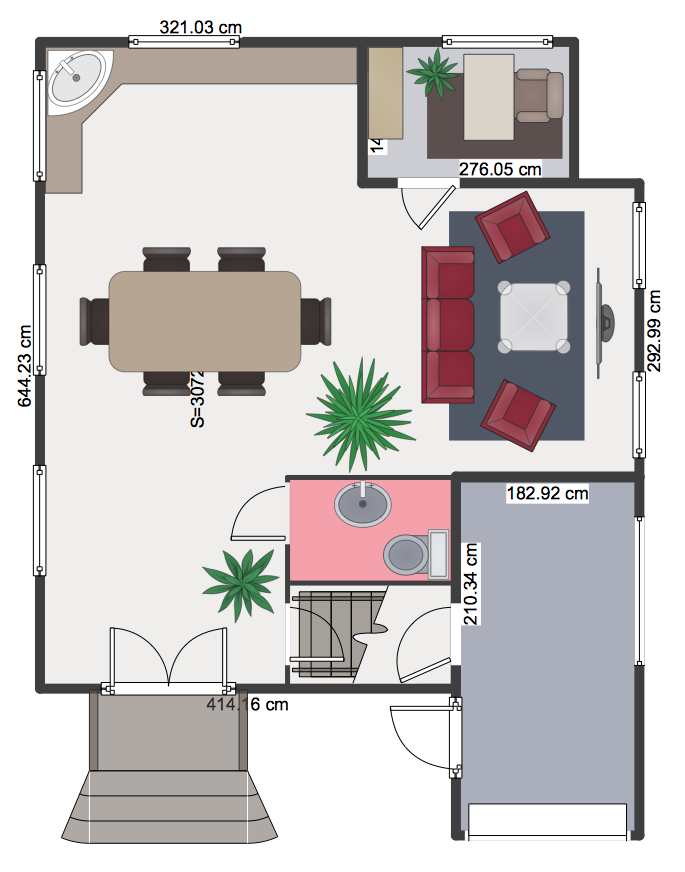
How to Create a Floor Plan Using ConceptDraw PRO
Making a floor plan is the best way to get a handle on how to organize your living space, and find out what could be changed. Creating a floor plan to scale is a challenge of the home and interior design process and can be noticeably helpful for visualizing things like furniture layout. You can use ConceptDraw PRO to produce layouts of real estate properties. ConceptDraw PRO contains the large quantity of pre-designed vector objects that you can use for quick and easy designing such floor plans. You can easily determine the size of the rooms and distances in you drawing. The ability to create a floor plan is delivered by the Floor Plans solution. This solution extends ConceptDraw PRO with libraries that contains over 500 objects of floor plan elements. There is a set of special objects that displays the sizes, corners, squares and other technical details using the current measurements of units.- How To Draw Block Diagram In Microsoft Powerpoint
- Building A Network With Diagrams Pdf
- How To Draw Block Diagram On Ppt Or Ms Word
- How To Draw Block Diagram In Word
- Draw Block Diagram In Word
- How To Draw Block Diagram In Word Document
- Step By Step Nature Drawing Pdf
- Steps To Draw Block Diagram
- Block Diagram | Telecommunication Network Diagrams | Cisco ...
- How To Convert a Block Diagram to Adobe PDF Using ...
- How To Draw A Network Diagram In Uml Pdf
- Block Diagram Of Lan With Components Pdf
- Types Of Networks With Block Diagram In Pdf File
- Cctv Camera Installation Block Diagram Pdf File
- Creating Net Work Diagrams Pdf
- Network Topologies Block Diagram Pdf
- How To Convert a Block Diagram to Adobe PDF Using ...
- Electrical Symbols, Electrical Diagram Symbols | Electrical Diagram ...
- How to Draw a Computer Network Diagrams
