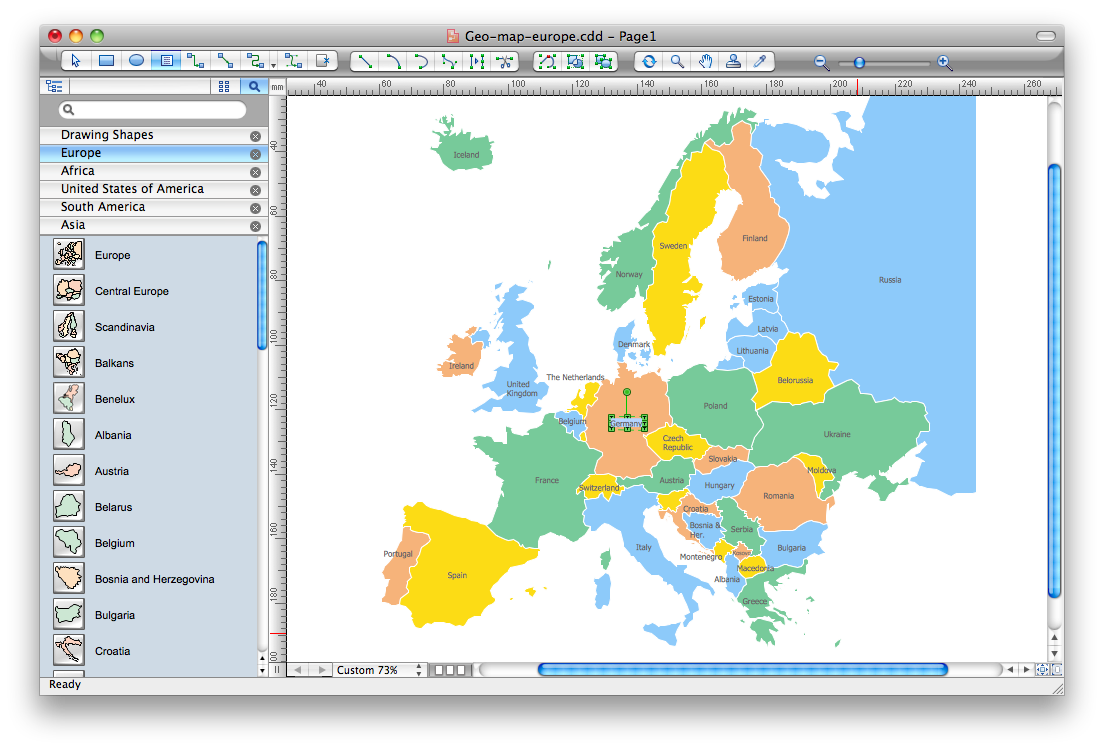
Map Software
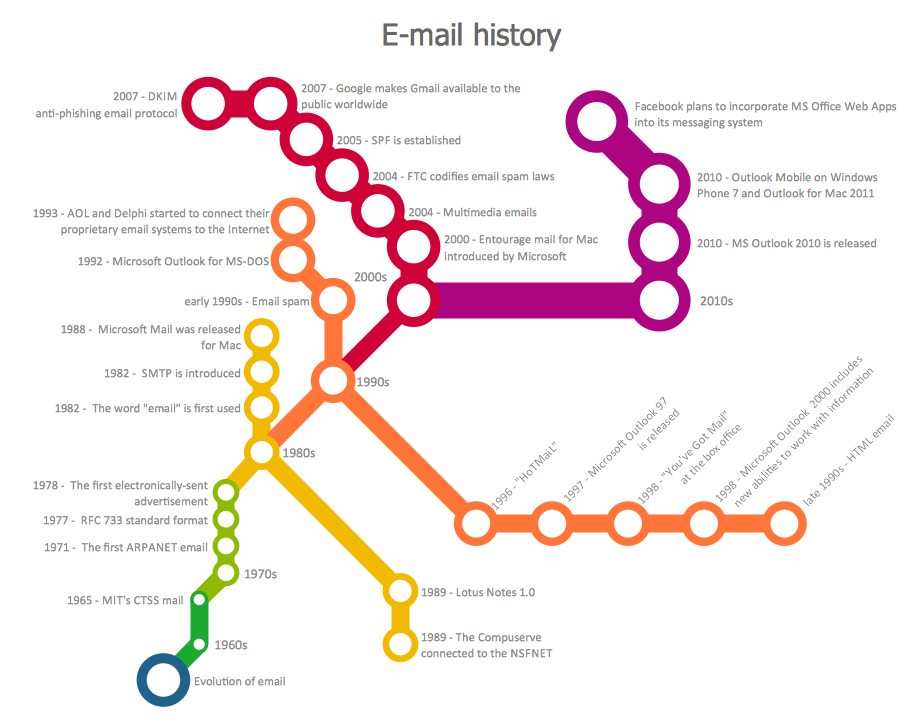
Create maps, flags, and more with ConceptDrawMetro Maps
ConceptDraw PRO software enhanced with Metro Map Solution from the Maps Area of ConceptDraw Solution Park provides extensive drawing tools for fast and easy creating various metro maps, route maps, transport schemes, metro path maps, subway train maps, and many other types of maps.Sample Pictorial Chart. Sample Infographics
Sample Pictorial Chart - Pictorial Infographics solution provides easy-to-use design infographics drawing tools, large collection of different sample infographics and infograms, sample pictorial chart and templates to be filled in, and 10 libraries with great quantity of predesigned vector pictograms. Use Pictorial Infographics solution to draw your own design pictorial infographics documents quick and easy.ConceptDraw Arrows10 Technology
How should diagramming software work? Is it possible to develop a diagram as quickly as the ideas come to you? The innovative ConceptDraw Smart Connectors Technology - This is more than enough versatility to draw any type of diagram with any degree of complexity. Connection points are necessary for diagramming network, flowchart and organizational charts. In ConceptDraw you connect shapes by attaching, or snapping and gluing, connectors to shape connection points.Process Flowchart
The main reason of using Process Flowchart or PFD is to show relations between major parts of the system. Process Flowcharts are used in process engineering and chemical industry where there is a requirement of depicting relationships between major components only and not include minor parts. Process Flowcharts for single unit or multiple units differ in their structure and implementation. ConceptDraw PRO is Professional business process mapping software for making Process flowcharts, Process flow diagram, Workflow diagram, flowcharts and technical illustrations for business documents and also comprehensive visio for mac application. Easier define and document basic work and data flows, financial, production and quality management processes to increase efficiency of your business with ConcepDraw PRO. Business process mapping software with Flowchart Maker ConceptDraw PRO includes extensive drawing tools, rich examples and templates, process flowchart symbols and shape libraries, smart connectors that allow you create the flowcharts of complex processes, process flow diagrams, procedures and information exchange. Process Flowchart Solution is project management workflow tools which is part ConceptDraw Project marketing project management software. Drawing charts, diagrams, and network layouts has long been the monopoly of Microsoft Visio, making Mac users to struggle when needing such visio alternative like visio for mac, it requires only to view features, make a minor edit to, or print a diagram or chart. Thankfully to MS Visio alternative like ConceptDraw PRO software, this is cross-platform charting and business process management tool, now visio alternative for making sort of visio diagram is not a problem anymore however many people still name it business process visio tools.
HelpDesk
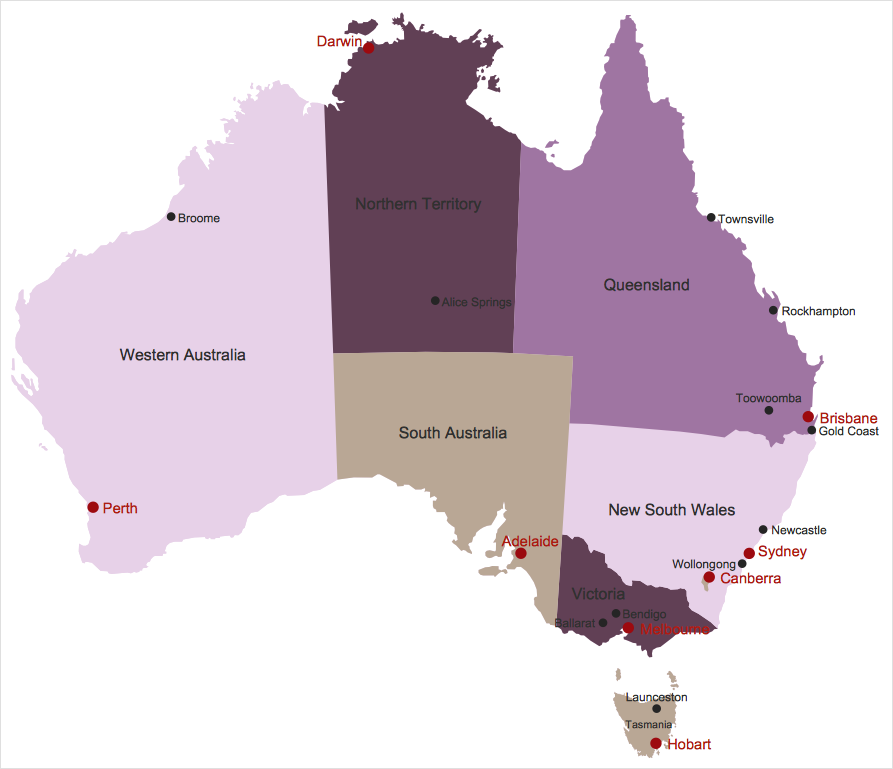
How to Draw Maps of Australia
Australia is the sixth largest country in the world. Australia consists from the mainland which is surrounded by many thousands of small fringing islands and numerous larger ones. The vast territories, aligned with interesting historic features across a wide expanse, make the thematic map an ideal way of depicting geographical, geological and political information related to Australia.The Australia Map solution for ConceptDraw PRO will help you to make the steps of the creativeness easy and intuitive. The Australia Map solution provides templates and samples along with vector stencils to get you started. Used together with other ConceptDraw PRO solutions it will allow you to create comprehensive geography-related infographics.HelpDesk
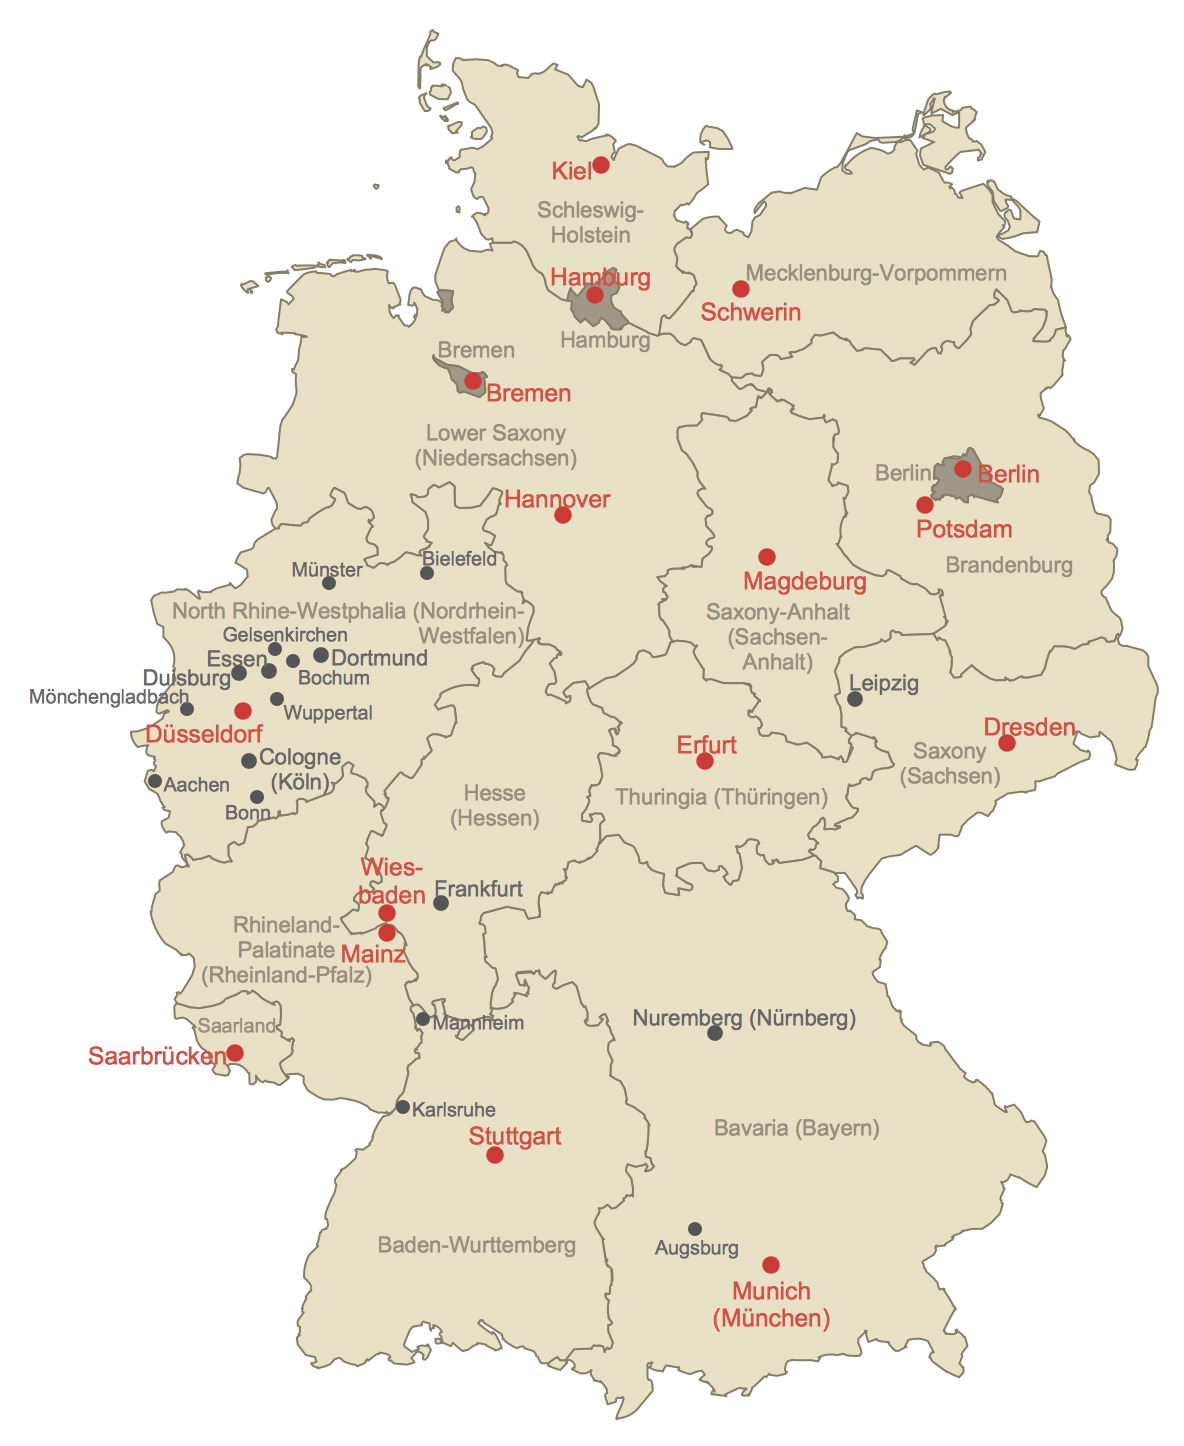
How to Create a Map of Germany Using ConceptDraw PRO
Geographical thematic maps are used to display information on a variety of subjects. It is a common way of representing any form of spatial data in relation to a specific geographical area. The Germany Map Solution for ConceptDraw PRO includes all of the German federal states with county outlined borders and major cities. You can quickly create geographic maps, cartograms, and thematic maps for geographical visualization information for business and travels.HelpDesk
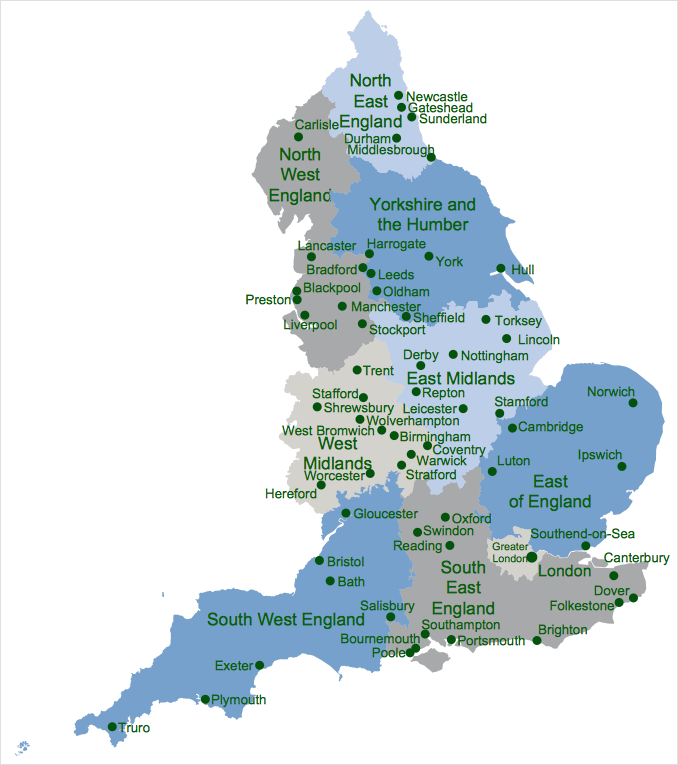
How to Create a Map Depicting the United Kingdom Counties and Regions
The UK Map Solution for ConceptDraw PRO includes all of the UK counties with county outlined borders, from the largest, North Yorkshire, to the smallest Rutlandshire. Geographical thematic maps are used to visualize information on a number of subjects related with certain geographical location . It is a common way of representing any form of spatial data in relation to a specific geographical area. The UK Map Solution for ConceptDraw PRO includes all of the United Kingdom counties with county outlined borders and major cities. You can quickly create geographic maps, cartograms, and thematic maps for geographical visualization information for business and travels.Design Pictorial Infographics. Design Infographics
In the course of recent decades data visualization went through significant development and has become an indispensable tool of journalism, business intelligence and science. The way visual information may be conveyed is not limited simply to static or dynamic representation, it can also be interactive. Infographics can be conditionally divided into several general levels. Primarily, this is level of visualization of information, its interpretation and association on any ground. Second level can be defined as a visualization of knowledge, depiction of thoughts and ideas in the form of images or diagrams. Finally, the level of data visualization, which processes data arrays in charts, enabling the information to be more clearly perceived. You can also identify the main approaches to the creation of infographics: exploratory and narrative. Exploratory method insists on minimalist design in favor of data precision without unnecessary details and is common for scientific researches and ana
 ConceptDraw Solution Park
ConceptDraw Solution Park collects graphic extensions, examples and learning materials
Best Tool for Infographic Construction
ConceptDraw is a best data visualization tool that will allow everyone to create rich infographics and visualizations quickly and easily.HelpDesk
How to Draw a Pictorial Chart in ConceptDraw PRO
Pictorial Infographics is used to visually present data comparison. Pictorial charts use relative sizes or repetitions of the same icon, picture, or symbol to show data relation. Using a Pictorial chart to show business data patterns and trends will add much more efficiency to your business communications. Finding the right tool for the job can sometimes be tricky. Developing sophisticated and effective infographics can require toolsthat may span many different products. Fortunately, ConceptDraw PRO has everything you need to create polished Pictorial Infographics that beautifully and accurately represent your story, no matter how complex it may be.How to Draw Pictorial Chart. How to Use Infograms
How to draw pictorial chart quick, easy and effective? ConceptDraw PRO offers the unique Pictorial Infographics Solution that will help you! Pictorial Infographics solution contains large number of libraries with variety of predesigned vector pictograms that allows you design infographics in minutes. There are available 10 libraries with 197 vector pictograms.Create Workflow Diagram
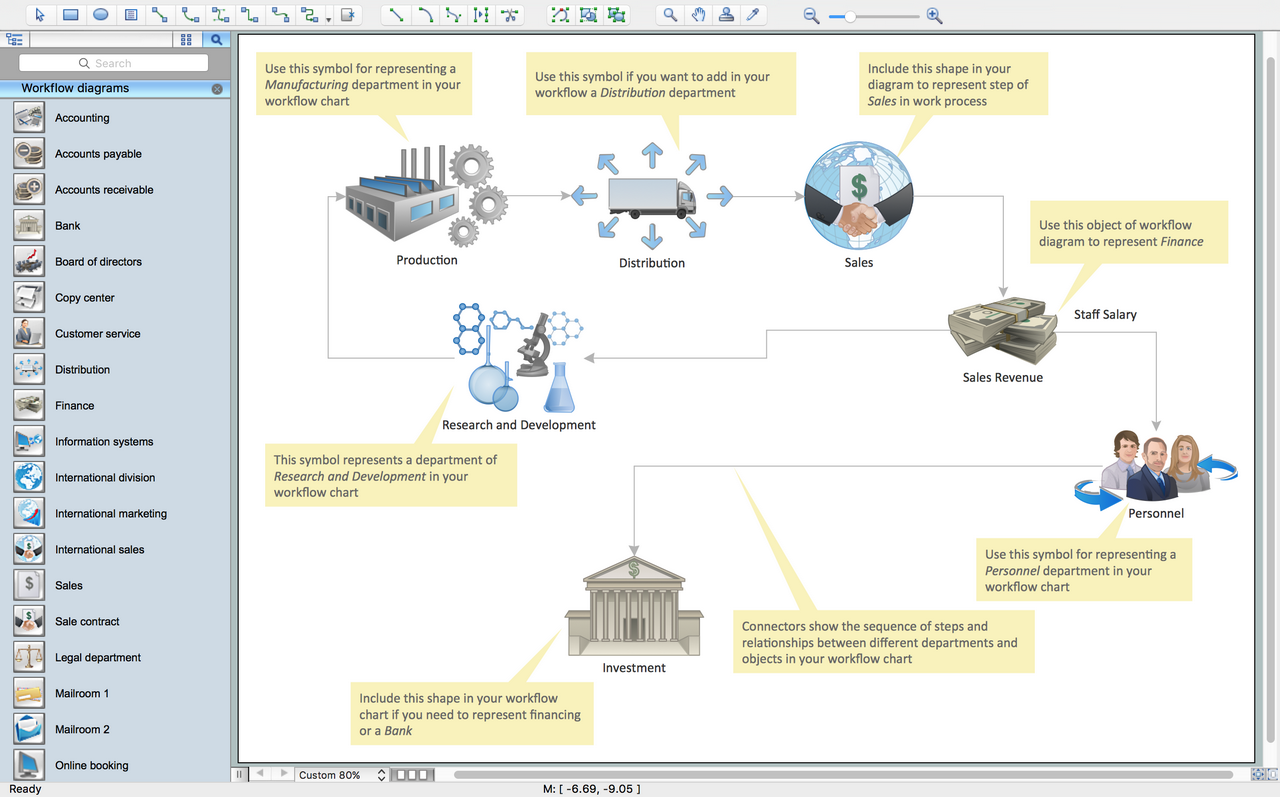
In any unclear situation create a workflow diagram. Workflow diagrams help to understand processes, find bottlenecks and fix the process. When you create workflow diagram using ConceptDraw PRO software you are able to focus on thinking, not drawing, that makes you as effective as possible.- How to Draw a Pictorial Chart in ConceptDraw PRO | Design ...
- Design elements - 3D directional maps | Directional Maps | 3D ...
- How To Draw Directional Maps
- Map Software | How to Draw a Natural Landscape | Nature ...
- 3d Drawing Maps
- Design elements - Day spa equipment layout plan | How to draw ...
- Map Software | How to Draw Pictorial Chart. How to Use Infograms ...
- Design elements - 3D directional maps | How To Create Restaurant ...
- Maps | 3D Network Diagram Software | Maps and Directions | 3d ...
- How to Draw a Map of North America Using ConceptDraw PRO ...
- How to draw Metro Map style infographics? (New York) | Map ...
- Directional Maps | How to Create a Directional Map Using ...
- Directional Maps | Design elements - 3D directional maps | 3D ...
- Geo Map - United States of America Map | How to Draw Maps of ...
- Directional Map Landmarks
- Simple Way To Draw Road Map
- Easy To Draw Map Of Europe
- Map Pictorial Symbols
- Infographic software: the sample of New York City Subway map ...
- How To Draw Germany Map
