HelpDesk
How to Draw a Pyramid Diagram

Pyramid Charts

Pyramid Diagram and Pyramid Chart

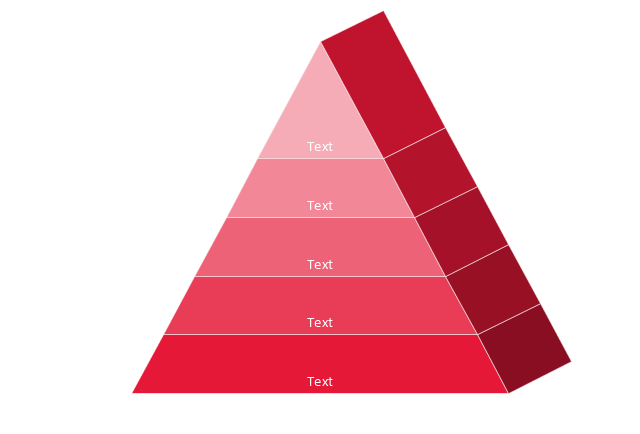
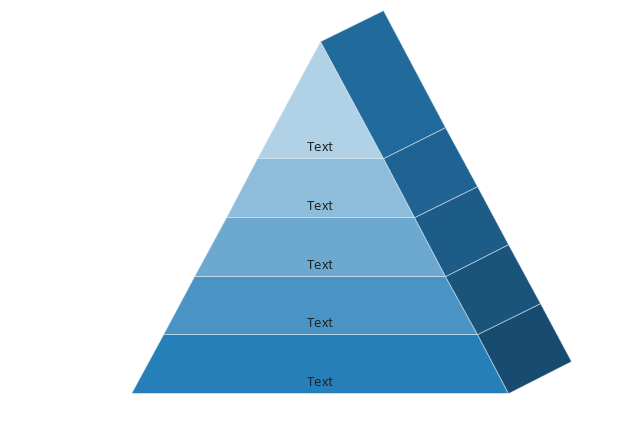
A five level pyramid model of different types of Information Systems based on the information processing requirement of different levels in the organization. The first level represents transaction processing systems to process basic data. The second level represents office support systems to process information in office. The third level represents management information systems to process information by managers. The fourth level represents decision support systems to process explicit knowledge. The fifth level represents executive information systems to process tacit knowledge.
"A Computer(-Based) Information System is essentially an IS using computer technology to carry out some or all of its planned tasks. The basic components of computer based information system are:
(1) Hardware - these are the devices like the monitor, processor, printer and keyboard, all of which work together to accept, process, show data and information.
(2) Software - are the programs that allow the hardware to process the data.
(3) Databases - are the gathering of associated files or tables containing related data.
(4) Networks - are a connecting system that allows diverse computers to distribute resources.
(5) Procedures - are the commands for combining the components above to process information and produce the preferred output.
The first four components (hardware, software, database and network) make up what is known as the information technology platform. Information technology workers could then use these components to create information systems that watch over safety measures, risk and the management of data. These actions are known as information technology services." [Information systems. Wikipedia]
This pyramid diagram was redesigned using the ConceptDraw PRO diagramming and vector drawing software from Wikimedia Commons file Five-Level-Pyramid-model.png. [commons.wikimedia.org/ wiki/ File:Five-Level-Pyramid-model.png]
This file is licensed under the Creative Commons Attribution 3.0 Unported license. [creativecommons.org/ licenses/ by/ 3.0/ deed.en]
The triangle chart example "Information systems types" is included in the Pyramid Diagrams solution from the Marketing area of ConceptDraw Solution Park.
Pyramid diagram

How to Create a Pyramid Diagram

 Pyramid Diagrams
Pyramid Diagrams solution extends ConceptDraw DIAGRAM software with templates, samples and library of vector stencils for drawing the marketing pyramid diagrams.
Pyramid Chart Examples

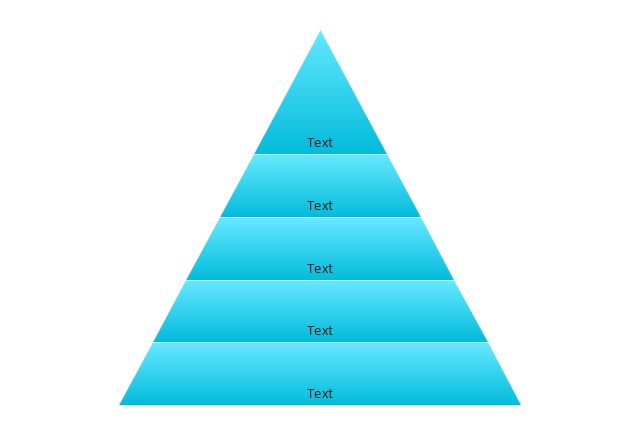
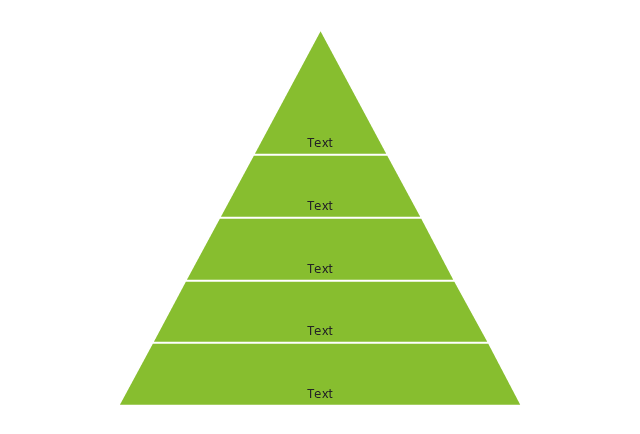
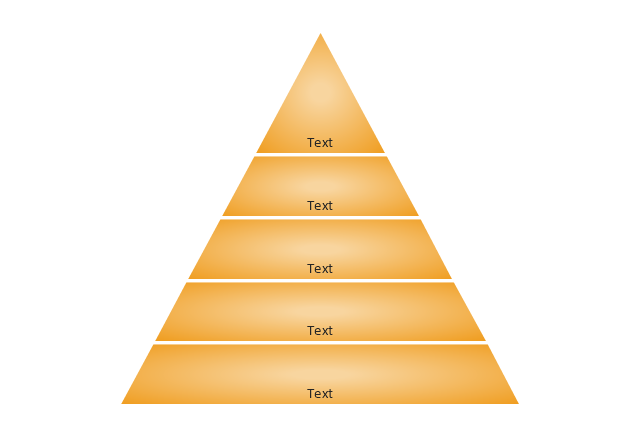
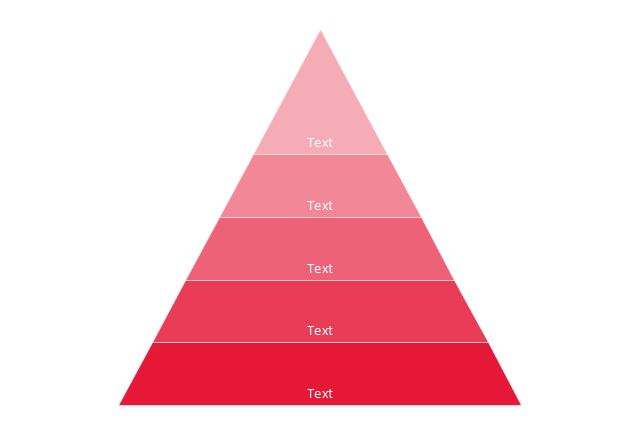
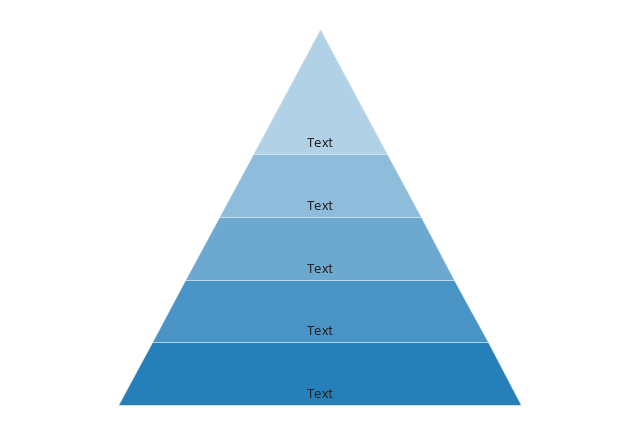
The vector stencils library "Pyramid diagrams" contains 28 templates of pyramid diagrams, triangle charts and triangular schemes.
Use these templates to create your pyramid diagrams in the ConceptDraw PRO diagramming and vector drawing software extended with the Pyramid Diagrams solution from the Marketing area of ConceptDraw Solution Park.
Use these templates to create your pyramid diagrams in the ConceptDraw PRO diagramming and vector drawing software extended with the Pyramid Diagrams solution from the Marketing area of ConceptDraw Solution Park.
Pyramid 1
Pyramid 2
Pyramid 3
Pyramid 4
Pyramid 5
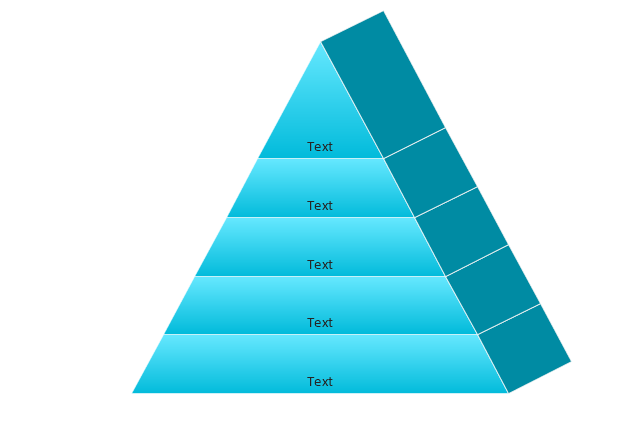
Pyramid 1 Isometric
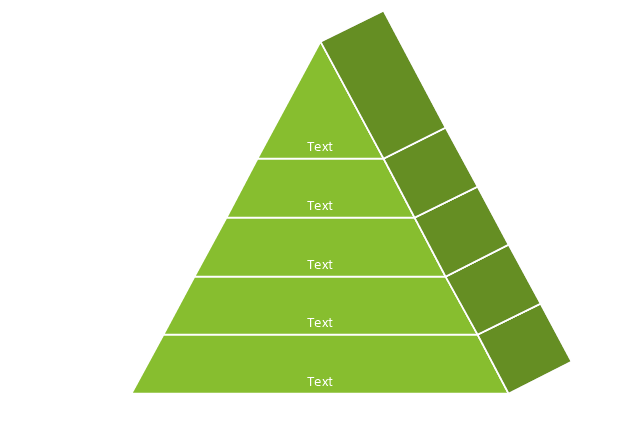
Pyramid 2 Isometric
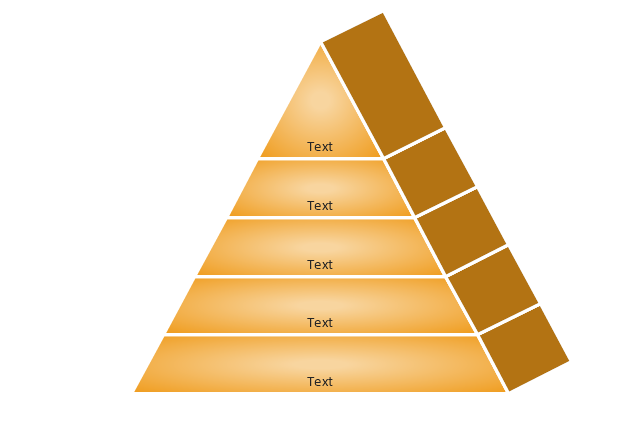
Pyramid 3 Isometric
Pyramid 4 Isometric
Pyramid 5 Isometric
Triangle diagram, arrows
Triangle diagram
Triangular pyramid
Triangular diagram
Triangle scheme
Triangle chart

Triangle chart, isometric

Triangular scheme
Arrowed block pyramid

Funnel diagram
3-level funnel diagram
4-level funnel diagram
5-level funnel diagram
2-level pyramid diagram
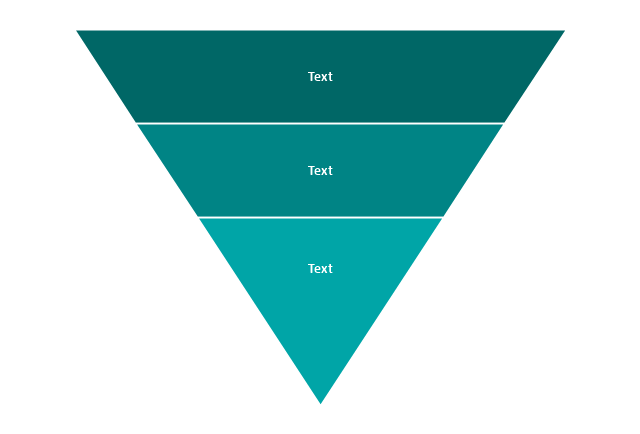
3-level pyramid diagram
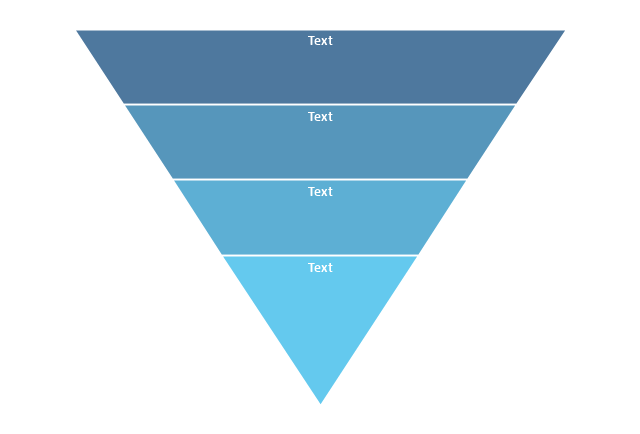
4-level pyramid diagram
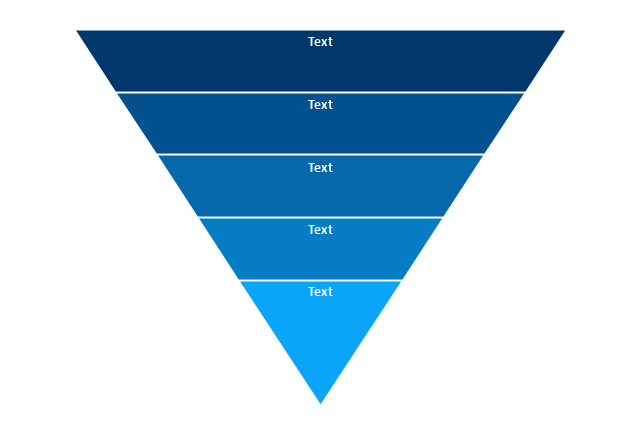
5-level pyramid diagram
6-level pyramid diagram
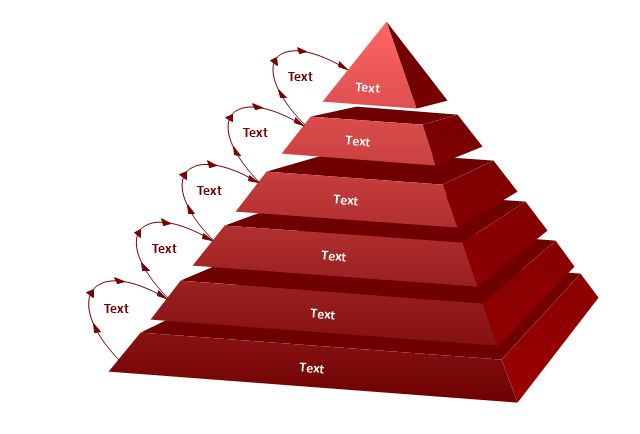
Diagram of a Pyramid

Energy Pyramid Diagram

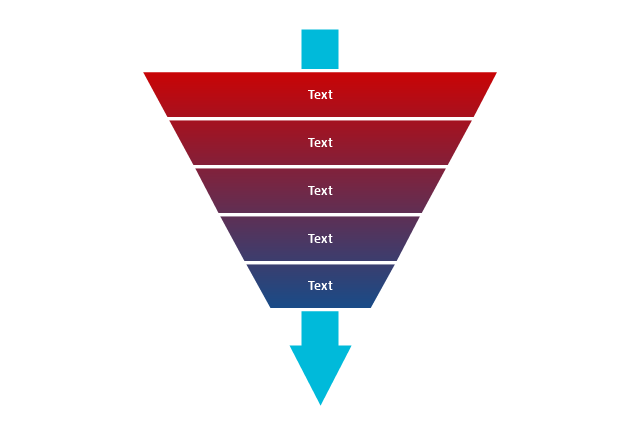
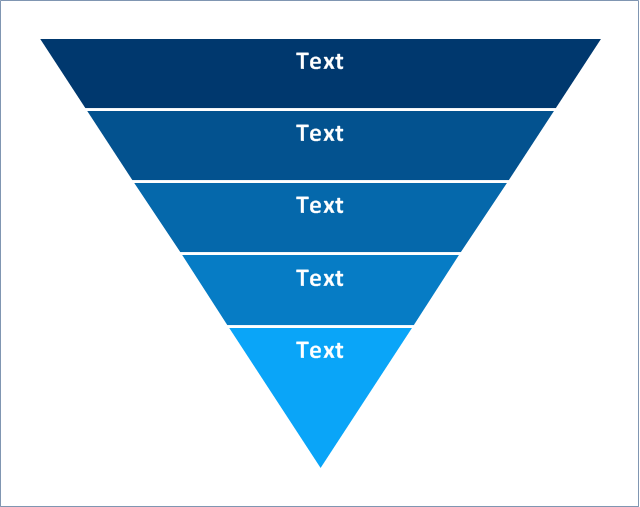
Use this 4-level funnel diagram template to quickly create your own marketing funnel diagrams using the ConceptDraw PRO diagramming and vector drawing software.
The 5-level funnel diagram template is included in the Pyramid Diagrams solution from the Marketing area of ConceptDraw Solution Park.
www.conceptdraw.com/ solution-park/ marketing-pyramid-diagrams
The 5-level funnel diagram template is included in the Pyramid Diagrams solution from the Marketing area of ConceptDraw Solution Park.
www.conceptdraw.com/ solution-park/ marketing-pyramid-diagrams
Funnel diagram
 25 Typical Orgcharts
The 25 Typical Orgcharts solution contains powerful organizational structure and organizational management drawing tools, a variety of professionally designed organization chart and matrix organization structure samples, 25 templates based on various orga
 Marketing Area
The solutions from Marketing area of ConceptDraw Solution Park collect templates, samples and libraries of vector stencils for drawing the marketing diagrams and mind maps.
 Site Plans
The Site Plans solution extends ConceptDraw DIAGRAM with samples, templates and numerous libraries of design elements making it powerful site plan software, ideal for landscape drawing, designing Site Plans, Site Layout Plans, Landscape Design Drawings, Home Site Plans, Hotel Site Plans, Park Site Plans, for developing the residential and commercial landscape design drawings and site plan, parks planning, landscaping territories, lighting trails, for creating drainage facilities, yard layouts, plant maps, outdoor recreational facilities, and irrigation systems plans.
 Bubble Diagrams
Bubble diagrams have enjoyed great success in software engineering, architecture, economics, medicine, landscape design, scientific and educational process, for ideas organization during brainstorming, for making business illustrations, presentations, planning, design, and strategy development. They are popular because of their simplicity and their powerful visual communication attributes.
 Continent Maps
Continent Maps solution extends ConceptDraw DIAGRAM software with templates, samples and libraries of vector stencils for drawing the thematic maps of continents, state maps of USA and Australia.
 Reflected Ceiling Plans
Reflected Ceiling Plans solution extends greatly the ConceptDraw DIAGRAM functionality with samples, templates and libraries of design elements for displaying the ceiling ideas for living room, bedroom, classroom, office, shop, restaurant, and many other premises. It is an effective tool for architects, designers, builders, electricians, and other building-related people to represent their ceiling design ideas and create Reflected Ceiling plan or Reflective Ceiling plan, showing the location of light fixtures, lighting panels, drywall or t-bar ceiling patterns, HVAC grilles or diffusers that may be suspended from the ceiling. Being professional-looking and vivid, these plans perfectly reflect your ceiling ideas and can be presented to the client, in reports, in presentations, on discussions with colleagues, or successfully published in modern print or web editions.
 IDEF0 Diagrams
IDEF0 Diagrams visualize system models using the Integration Definition for Function Modeling (IDEF) methodology. Use them for analysis, development and integration of information and software systems, and business process modelling.
 Network Layout Floor Plans
Network Layout Floor Plans solution extends ConceptDraw DIAGRAM software functionality with powerful tools for quick and efficient documentation the network equipment and displaying its location on the professionally designed Network Layout Floor Plans. Never before creation of Network Layout Floor Plans, Network Communication Plans, Network Topologies Plans and Network Topology Maps was not so easy, convenient and fast as with predesigned templates, samples, examples and comprehensive set of vector design elements included to the Network Layout Floor Plans solution. All listed types of plans will be a good support for the future correct cabling and installation of network equipment.
 USA Maps
Use the USA Maps solution to create a map of USA, a US interstate map, printable US maps, US maps with cities and US maps with capitals. Create a complete USA states map.
- 5 level pyramid model diagram of information systems types ...
- Pyramid Diagram | 5 Level pyramid model diagram - Information ...
- 4 Level pyramid model diagram - Information systems types | 5 Level ...
- Pyramid Diagram | Pyramid Diagram | 4 Level pyramid model ...
- How to Create Flowcharts for an Accounting Information System | 5 ...
- 5 Level pyramid model diagram - Information systems types | 4 Level ...
- 5 level pyramid model diagram of information systems types | 4 level ...
- Pyramid Diagram | 5 level pyramid model diagram of information ...
- 5 Level pyramid model diagram - Information systems types ...
- 4 Level pyramid model diagram - Information systems types ...
- Pyramid Diagram | Pyramid Diagram | 5 Level pyramid model ...
- How to Create Flowcharts for an Accounting Information System | 4 ...
- 4 Level pyramid model diagram - Information systems types | 5 Level ...
- 4 Level pyramid model diagram - Information systems types ...
- 5 Level pyramid model diagram - Information systems types ...
- Process Flowchart | 5 Level pyramid model diagram - Information ...
- Pyramid diagram - Template | Pyramid Diagram and Pyramid Chart ...
- Template To Create A Triangular Pyramid
- Pyramid Diagram | 5 Level pyramid model diagram - Information ...
- 4 Level pyramid model diagram - Information systems types ...