This site uses cookies. By continuing to browse the ConceptDraw site you are agreeing to our Use of Site Cookies.

Cloud computing, Architecture Diagrams, Cloud Computing Architecture, How Cloud Computing Works, amazon cloud computing architecture, introduction to cloud computing architecture Cloud Computing Diagrams

Cloud computing, Architecture Diagrams, Cloud Computing Architecture, How Cloud Computing Works, amazon cloud computing architecture, introduction to cloud computing architecture
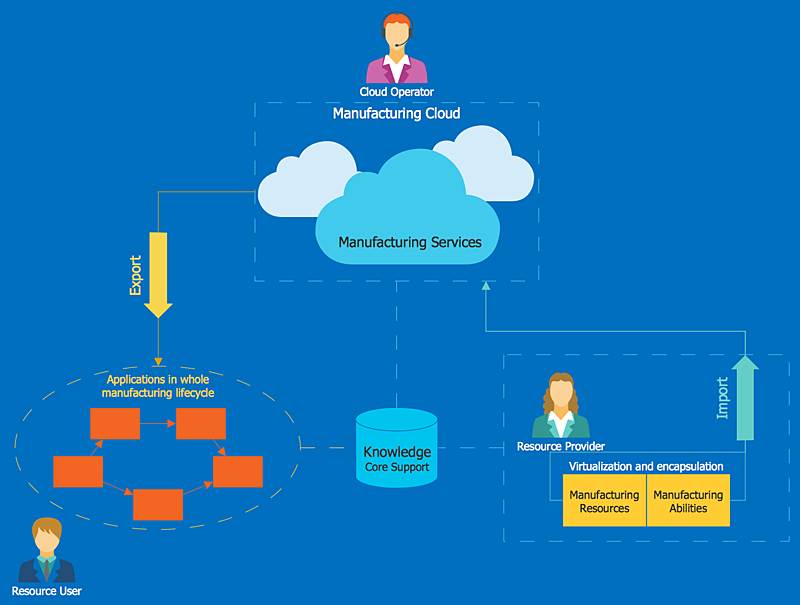
The Cloud Computing Diagrams solution extends the functionality of the ConceptDraw DIAGRAM diagramming software with a comprehensive collection of libraries of commonly accepted cloud computing vector stencils to help you to get started designing Cloud Computing Diagrams, Architecture Diagrams and Cloud Computing Architecture Diagrams without effort. This solution lets one professionally depict the way how the cloud computing works, allows giving a powerful introduction to the Cloud computing architecture and Amazon cloud computing architecture, to display the essence of the cloud computing, the main characteristics and classification of the cloud services thanks to the wide variety of predesigned samples and examples.

Introduction to Cloud Computing Architecture

The best way to visualize the introduction to Cloud computing architecture is to create diagrams and schematics representing what is a cloud computing and how it works. For their design, we recommend to use a powerful ConceptDraw DIAGRAM diagramming and vector drawing software supplied with Cloud Computing Diagrams solution from the Computers and Network area of ConceptDraw Solution Park
HelpDesk

How to Create a Cloud Computing Diagram

Cloud computing is a model of remote access to shared computing resources that are physically distributed in many remote devices. Cloud Computing is a technology that allows using the Internet to place computing resources and the provision of such services to customers. Using cloud computing means assigning responsibilities on applications and data storage service among special systems, which have a very high level of reliability and unlimited resources. The result is reducing the cost of service and providing users with ready-to-use service.
ConceptDraw's Cloud Computing Diagrams solution allows you to visualize cloud computing models of any configuration and complexity.

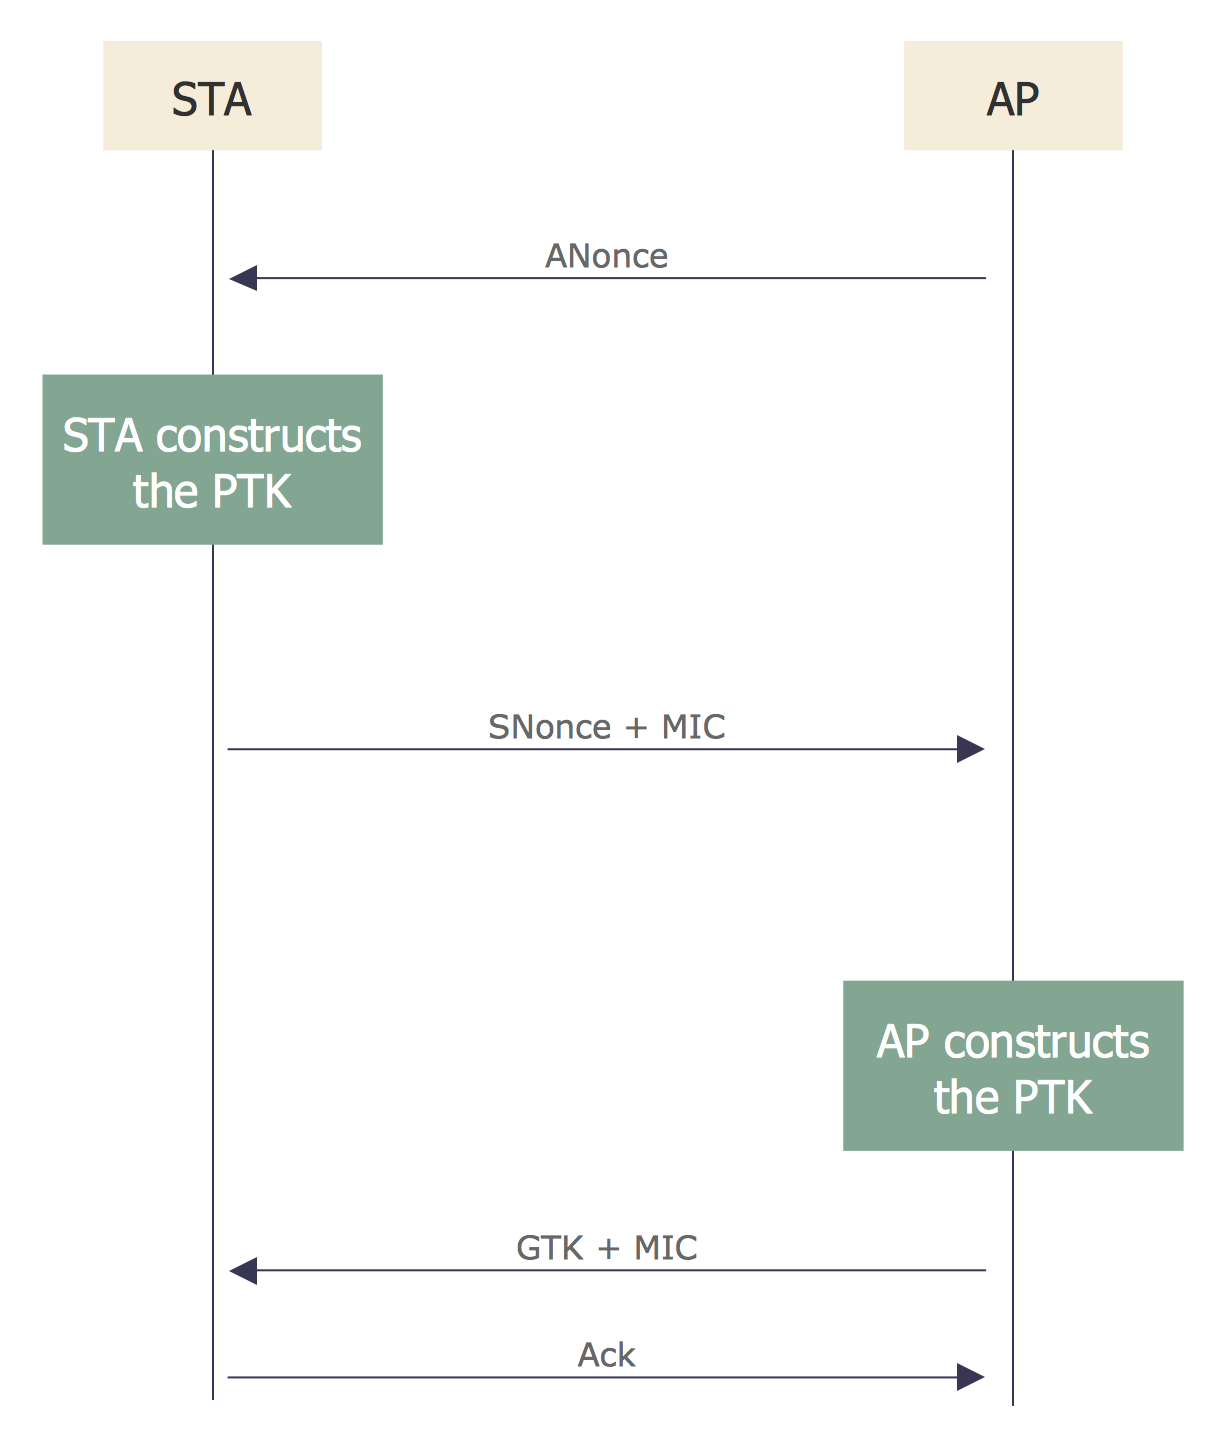
Sequence Diagram for Cloud Computing

One of the ways effectively visualize what is a Cloud computing or Cloud computing architecture, is to create the Sequence diagram for Cloud computing. The ConceptDraw DIAGRAM diagramming and vector drawing software enhanced with Cloud Computing Diagrams solution from the Computers and Network area of ConceptDraw Solution Park will help you design all desired types of diagrams related with cloud computing.

ConceptDraw Solution Park ConceptDraw Solution Park

ConceptDraw Solution Park
ConceptDraw Solution Park collects graphic extensions, examples and learning materials

Cloud Computing Architecture Diagrams

For documenting the Cloud Computing Architecture with a goal to facilitate the communication between stakeholders are successfully used the Cloud Computing Architecture diagrams. It is convenient and easy to draw various Cloud Computing Architecture diagrams in ConceptDraw DIAGRAM software with help of tools of the Cloud Computing Diagrams Solution from the Computer and Networks Area of ConceptDraw Solution Park.

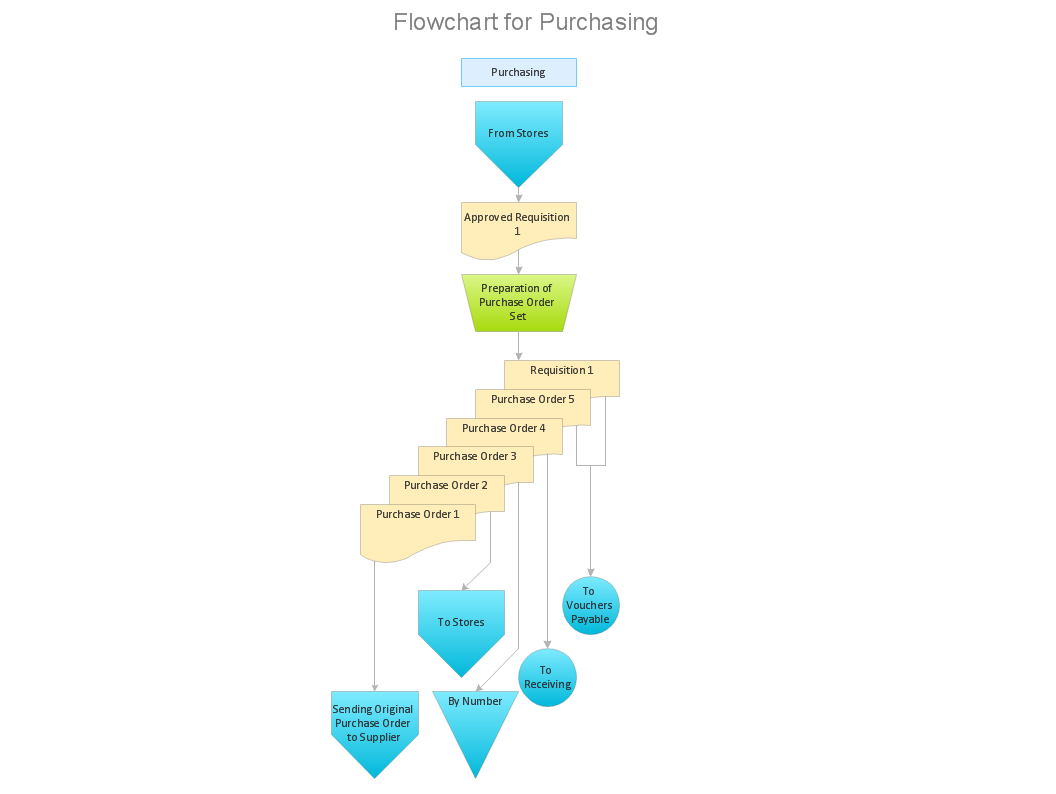
Introduction to bookkeeping: Accounting flowchart process

Everything about Bookkeeping: Accounting flowchart process. Which symbols to use, how to make a chart.

Flowchart Example: Flow Chart of Marketing Analysis

An example flowchart of marketing analysis shows main steps you have to challenge writing a marketing analysis.

Create Organizational Chart

CSOdessa team is happy to provide cost effective Organizational Chart Software for companies of any size. It is a ConceptDraw DIAGRAM extended with Organizational Charts Solution from the Management Area.
ConceptDraw DIAGRAM organizational chart professional software allows quickly create organizational charts, flow charts, time lines, and much more. Use it for drawing organizational chart for any size company and analyzing organizational structure. Use ConceptDraw to create organizational chart, visualize company Organizational chart, hospital Organizational chart, hotel Organizational chart, corporate organizational chart, etc.

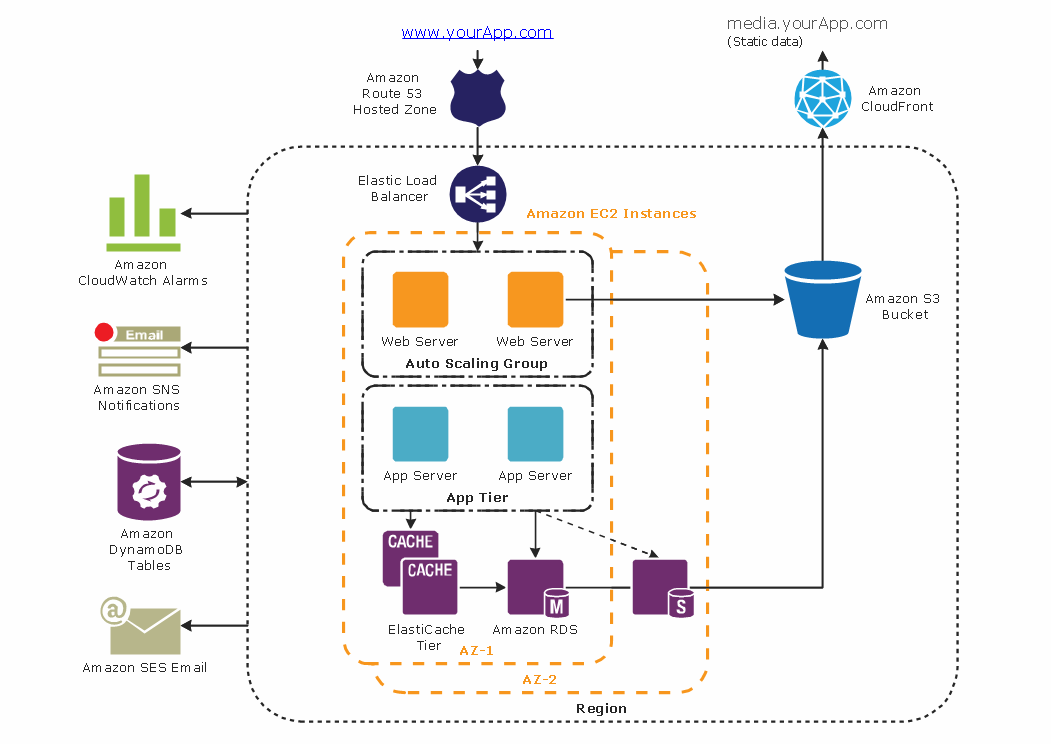
Amazon Web Services Diagrams diagramming tool for architecture

The AWS Architecture Diagrams solution includes icons, sample and templates for several Amazon Web Services products and resources, to be used when creating architecture diagrams. The icons are designed to be simple so that you can easily incorporate them in your diagrams and put them in your whitepapers, presentations, datasheets, posters or any technical material you like. Here you will find an official collection of AWS resources that will help you build great AWS Architecture diagrams.

Project — Assigning Resources

Users new to ConceptDraw PROJECT will find the Basic lessons an essential platform for familiarizing themselves with the program′s functions. Learn how to assign resources to tasks in ConceptDraw PROJECT with this comprehensive video lesson.
Lessons for Assigning Resources using project management software ConceptDraw PROJECT

Diagramming tool - Amazon Web Services and Cloud Computing Diagrams

The AWS Architecture Diagrams solution includes icons, sample and templates for several Amazon Web Services products and resources, to be used when creating architecture diagrams. The icons are designed to be simple so that you can easily incorporate them in your diagrams and put them in your whitepapers, presentations, datasheets, posters or any technical material you like.

draw pie chart, draw donut chart Pie Charts

draw pie chart, draw donut chart
Pie Charts are extensively used in statistics and business for explaining data and work results, in mass media for comparison (i.e. to visualize the percentage for the parts of one total), and in many other fields. The Pie Charts solution for ConceptDraw DIAGRAM offers powerful drawing tools, varied templates, samples, and a library of vector stencils for simple construction and design of Pie Charts, Donut Chart, and Pie Graph Worksheets.

Flow Chart Creator

It is impossible to imagine the managing and analyzing of business and technical processes without flowcharts. They are the best way to visually represent the structural data, algorithms, the steps of the process, they allow to illustrate the process flow direction and solution to a given problem. ConceptDraw DIAGRAM diagramming and vector drawing software extended with flowchart maker and Flowcharts Solution from the "Diagrams" Area is a powerful Flow Chart Creator.