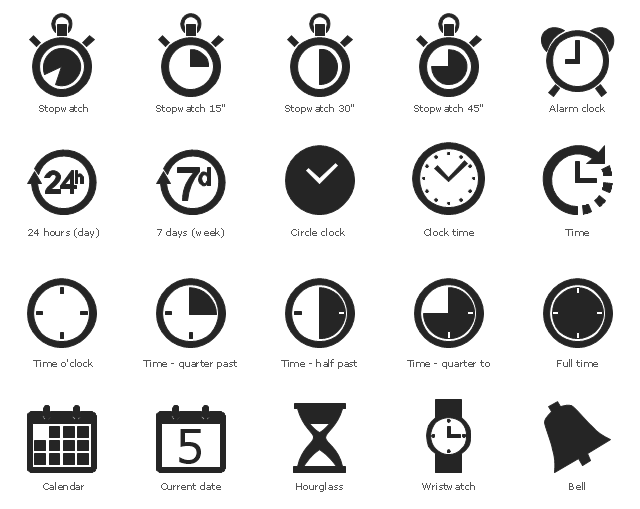
The vector stencils library "Time and clock pictograms" contains 20 time pictograms: clocks, calendars, day, week, bell, alarm clock, hourglass, wristwatch, and time intervals symbols.
Use it to create temporal infographic, illustrations and diagrams.
The example "Time and clock pictograms - Vector stencils library" was created using the ConceptDraw PRO diagramming and vector drawing software extended with the Pictorial infographics solution from the area "What is infographics" in ConceptDraw Solution Park.
Time
Stopwatch
Stopwatch 15"
Stopwatch 30"
Stopwatch 45"
24 h
7 d
Circle clock

Clock time
Time o'clock
Time - quarter past
Time - half past
Time - quarter to
Full time
Calendar

Current date

Hourglass

Wristwatch
Alarm clock
Bell

The vector stencils library "Time and clock pictograms" contains 20 time pictograms: clocks, calendars, day, week, bell, alarm clock, hourglass, wristwatch, and time intervals symbols.
Use it to create temporal infographic, illustrations and diagrams.
The pictograms example "Design elements - Time and clock pictograms" was created using the ConceptDraw PRO diagramming and vector drawing software extended with the Pictorial Infographic solution from the area "What is infographics" in ConceptDraw Solution Park.
Temporal pictograms
The vector stencils library "Time" contains 20 time and clock icons.
Use it to design your business and finance illustrations and infographics with ConceptDraw PRO diagramming and vector drawing software.
The vector stencils library "Time" is included in the Business and Finance solution from the Illustration area of ConceptDraw Solution Park.
Use it to design your business and finance illustrations and infographics with ConceptDraw PRO diagramming and vector drawing software.
The vector stencils library "Time" is included in the Business and Finance solution from the Illustration area of ConceptDraw Solution Park.
Wall clock
Alarm clock

Electronic clock
Dual watch
Sand glass
Tower clock
Stopwatch

Metronome

Working time

Rest time

Waiting time
Dinner time

Coming late

Coming in time

Time management
Morning

Afternoon

Evening

Night

Around the clock

ERD Symbols and Meanings


The vector stencils library "HR symbols" contains 45 HR pictograms.
Use this icon set with HR symbols to draw your HR flowcharts, workflow diagrams, process charts and infographics with the ConceptDraw PRO diagramming and vector drawing software.
The HR pictograms library "HR symbols" is included in the HR Flowcharts solution from the Management area of ConceptDraw Solution Park.
Absence management

Absenteeism

Achievement

Attract
Authority and accountability

Business goals

Business success

Capital formation

Career

Career ladder

Communication

Compensation management

Conflict management

Conformance

Dress code

Education

Global HR

Headhunting

Hierarchical organization

Human capital

Human resource management

Incentive compensation management

Increase productivity

Job performance

Job satisfaction

Labor Unions

Leadership

Motivation and incentives

Organizational culture

Partnership

Performance management

Problem solving

Retention

Skill

Smart ideas

Staff turnover

Succession management

Talent acquisition

Time efficiency

Time management

Timekeeping
Winner

Workforce planning

Workplace culture

Workplace health and safety

Flowchart Programming Project. Flowchart Examples

The vector stencils library "HR symbols" contains 45 HR pictograms.
Use this icon set with HR symbols to draw your HR flowcharts, workflow diagrams, process charts and infographics with the ConceptDraw PRO diagramming and vector drawing software.
The HR pictograms library "HR symbols" is included in the HR Flowcharts solution from the Management area of ConceptDraw Solution Park.
Use this icon set with HR symbols to draw your HR flowcharts, workflow diagrams, process charts and infographics with the ConceptDraw PRO diagramming and vector drawing software.
The HR pictograms library "HR symbols" is included in the HR Flowcharts solution from the Management area of ConceptDraw Solution Park.
Absence management
Absenteeism
Achievement
Attract
Authority and accountability
Business goals
Business success
Capital formation
Career
Career ladder
Communication
Compensation management
Conflict management
Conformance
Dress code
Education
Global HR
Headhunting
Hierarchical organization
Human capital
Human resource management
Incentive compensation management
Increase productivity
Job performance
Job satisfaction
Labor Unions
Leadership
Motivation and incentives
Organizational culture
Partnership
Performance management
Problem solving
Retention
Skill
Smart ideas
Staff turnover
Succession management
Talent acquisition
Time efficiency
Time management
Timekeeping
Winner
Workforce planning
Workplace culture
Workplace health and safety
Infographic Maker

Design Pictorial Infographics. Design Infographics

- Hourglass Illustration Png
- Time and clock pictograms - Vector stencils library | Time and clock ...
- Time and clock pictograms - Vector stencils library | Design ...
- Hourglass Png
- Proposed Patient Appointment Procedure | Time and clock ...
- Hourglass Vector Png
- Time and clock pictograms - Vector stencils library | Time and clock ...
- Time and clock pictograms - Vector stencils library | Time and clock ...
- How to Customize a Task's Duration | Time and clock pictograms ...
- Export from ConceptDraw PRO Document to a Graphic File | Time ...
- Infographic Time Png
- Time Symbols Png
- Time and clock pictograms - Vector stencils library | Time and clock ...
- Time and clock pictograms - Vector stencils library | Time and clock ...
- Half Circle Png
- Vector The Time Png
- Hourglass Icon Png
- Time Png Clipart
- Time Vector Image Png
- Time and clock pictograms - Vector stencils library | Calendars ...