Pyramid Diagram

Design Pictorial Infographics. Design Infographics

Export from ConceptDraw PRO Document to a Graphic File


Typography Infographic Examples

Infographic Maker

How to Make an Infographic

 Time Series Dashboard
Time series dashboard solution extends ConceptDraw PRO software with templates, samples and vector stencils libraries with charts, graphs and plots for drawing the visual dashboards showing data time series.
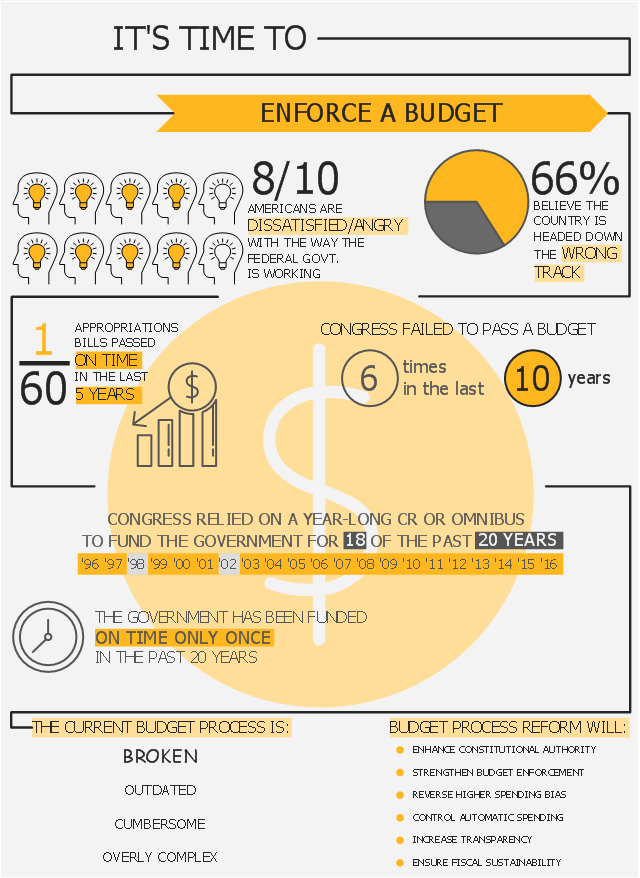
This finance infographic sample was designed on the base of the infographic "It's time to enforce a budget" from the website of the Committee on the Budget: U.S. House of Representatives. [budget.house.gov/ uploadedfiles/ bprinfographic.jpg]
"The U.S. House Committee on the Budget, commonly known as the House Budget Committee, is a standing committee of the United States House of Representatives. Its responsibilities include legislative oversight of the federal budget process, reviewing all bills and resolutions on the budget, and monitoring agencies and programs funded outside of the budgetary process." [United States House Committee on the Budget. Wikipedia]
The finance infographic sample "It's time to enforce a budget" was designed using ConceptDraw PRO software extended with Finanlial Infographics solution from Business Infographic area of ConceptDraw Solution Park.
Financial infogram
- Hourglass Time Png
- Time Pictogram Png
- Vector Png Time
- Time Vector Png
- Vector The Time Png
- Time and clock pictograms - Vector stencils library | Time - Vector ...
- Timer Picto Png
- Time and clock pictograms - Vector stencils library | Time and clock ...
- Time - Vector stencils library | Travel and tourism pictograms - Vector ...
- Network Icon | Time and clock pictograms - Vector stencils library ...