This site uses cookies. By continuing to browse the ConceptDraw site you are agreeing to our Use of Site Cookies.

healthcare workflow diagram, healthcare workflow, healthcare workflow management, workflow analysis healthcare, clinical workflows in healthcare Healthcare Management Workflow Diagrams

healthcare workflow diagram, healthcare workflow, healthcare workflow management, workflow analysis healthcare, clinical workflows in healthcare
Healthcare Management Workflow Diagrams solution contains large set of colorful samples and libraries with predesigned vector pictograms and symbols of health, healthcare equipment, medical instruments, pharmaceutical tools, transport, medication, departments of healthcare organizations, the medical icons of people and human anatomy, as well as the predesigned flowchart objects, connectors and arrows, which make it the best for designing clear and comprehensive Medi?al Workflow Diagrams and Block Diagrams, Healthcare Management Flowcharts and Infographics, Healthcare Workflow Diagram, for depicting the healthcare workflow and clinical workflows in healthcare, for making the workflow analysis healthcare and healthcare workflow management.
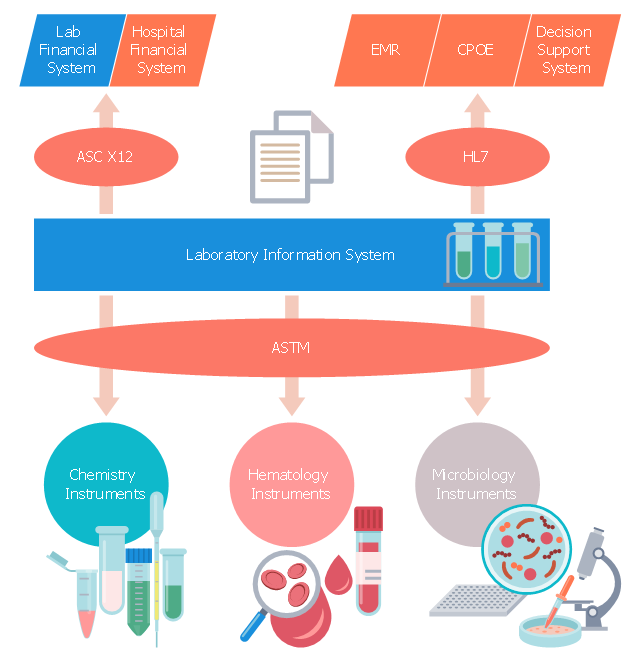
This medical flow chart sample shows logical connections to/ from laboratory information system (LIS) within the hospital.
It was drawn on the base of Wikimedia Commons file: WithinHospital.jpg. [commons.wikimedia.org/ wiki/ File:WithinHospital.jpg]
This file is licensed under the Creative Commons Attribution-Share Alike 3.0 Unported license. [creativecommons.org/ licenses/ by-sa/ 3.0/ deed.en]
"A laboratory information management system (LIMS), sometimes referred to as a laboratory information system (LIS) or laboratory management system (LMS), is a software-based laboratory and information management system with features that support a modern laboratory's operations. Key features include — but are not limited to — workflow and data tracking support, flexible architecture, and data exchange interfaces, which fully "support its use in regulated environments". The features and uses of a LIMS have evolved over the years from simple sample tracking to an enterprise resource planning tool that manages multiple aspects of laboratory informatics." [Laboratory information management system. Wikipedia]
The medical flowchart example "Laboratory Information System within the hospital" was designed using ConceptDraw PRO software extended with Healthcare Workflow Diagrams solution from Business Processes area of ConceptDraw Solution Park.
Medical flowchart
Medical flowchart, vacutainer, blood tube, test tube, rectangle, pasteur pipette, parallelogram, microtiter plate, microcentrifuge tube, microbiological laboratory, hematology, file, eyedropper, ellipse, drawing shapes, document, circle, centrifuge tube, biochemical laboratory, arrow up, arrow down, Petri dish,
HelpDesk

How to Create a Healthcare Management Workflow Diagram

The health and medical workflow diagrams are widespread in medicine to depict the sequence of actions of the medical workers to eliminate particular health problems of the patient. Also drawing is the best way to illustrate processes occurring in the human body. Healthcare Management Workflow Diagrams for ConceptDraw DIAGRAM provides the large set of colorful samples and libraries with predesigned vector pictograms and symbols of health, healthcare equipment, medical instruments, pharmaceutical tools, transport, medication, etc. The Healthcare Management Workflow Diagrams solution found in the Business Processes section of ConceptDraw Solution Park is the best choice for designing clear and comprehensive Medical Workflow Diagrams, Healthcare Management Flowcharts and Infographics.

workflow diagram software, workflow patterns Workflow Diagrams

workflow diagram software, workflow patterns
Workflow Diagrams solution extends ConceptDraw DIAGRAM software with samples, templates and vector stencils library for drawing the work process flowcharts.

business process flow diagrams, business process diagram example, business process diagram, process diagrams Business Process Diagrams

business process flow diagrams, business process diagram example, business process diagram, process diagrams
Business Process Flow Diagrams solution extends the ConceptDraw DIAGRAM BPM software with RapidDraw interface, templates, business process diagrams examples and numerous libraries based on the BPMN 1.2 and BPMN 2.0 standards, which give you the possibility to visualize equally easy simple and complex processes, to design business models, to quickly develop and document in details any business processes on the stages of project’s planning and implementation.

How to Create Flowcharts for an Accounting Information System

Accounting information is a system of interrelated processes which represent financial and accounting data, required for decision making. For representing the accounting processes in a visual and easy for perception form are constructed Accounting Flowcharts. For their creation are used special flowchart symbols, this makes Accounting flowcharts understandable for all users of accounting information system and helps them easy understand the sequence of steps involved to accounting processes. But how to create Flowcharts for an Accounting Information System fast and easy? Use of special design software is useful for this. ConceptDraw DIAGRAM software extended with Accounting Flowcharts solution is the best for creation accurate Accounting Flowcharts, for documentation and visually communication on how accounting processes work, how each operation is done. Accounting Flowcharts solution is supplied with library of predesigned commonly used vector symbols, Accounting Flowchart templates and samples demonstrating receiving, purchasing, payment, and other accounting processes.

How to Draw an Organization Chart

An Organizational chart is a type of diagram which visually displays the structure of an organization, relationships and relative ranks of the organization′s parts and positions. Organizational chart is constructed as an hierarchical structure, in the form of tree. How to Draw an Organization Chart the most easy and quickly? The Organizational Charts solution, innovative Tree Auto-connection mode and ConceptDraw Arrows10 Technology included in ConceptDraw DIAGRAM software are powerful drawing tools that change the way of diagrams production. Arrows10 Technology provides smart behavior for the connectors, and so quick and precise placement when drawing, and lets easy make the changes and automatic rearrangement. It helps to make the process of drawing diagrams more efficient, easier and faster. Now, you don′t need to think on how to connect or place the objects, you can concentrate fully on what to draw. See obligatory the helpful video tutorial about creation the Organization Charts and orgchart professional presentations with ConceptDraw products.

Program to Make Flow Chart

Use ConceptDraw DIAGRAM diagramming and business graphics software for drawing your own PM life cycle flow charts.

Work Order Process Flowchart. Business Process Mapping Examples

The business process is a set of actions or tasks which are undertaken by an organization for production some goods or services, they are then offered for the customers and are ordered by them. Process Flowcharts and Order Process Flowcharts are sufficiently prevalent, well known and actively used in variety of fields of life, business and science. They are constructed using the common standardized symbols, thus are clear and understandable for all. They help effectively represent the processes, determine the order in which the process activities happen, document the order processes, and also effectively analyze the processes with a goal to increase their efficiency. Create your own Process Flowcharts, Order Process Flowcharts, Cross-Functional Flow Charts representing the order processing steps using powerful drawing tools of ConceptDraw DIAGRAM software and variety of predesigned vector objects from the libraries of Business Process Mapping Solution from Business Processes area of ConceptDraw Solution Park.

Organization Chart Software

Create Organizational Chart Software - You need create Organizational Chart? Nothing could be easier with ConceptDraw DIAGRAM diagramming and vector drawing software. ConceptDraw DIAGRAM presents the Organizational Charts Solution from the Management Area that will allow you to draw the Organization Charts of any difficulty easy and quick.
How to draw an Organizational Chart

Examples of Flowcharts, Org Charts and More

ConceptDraw DIAGRAM covers a broad spectrum of business graphics categories and offers at ConceptDraw STORE enormous online collection of pictorial examples and samples for different thematics and application areas. It is a plentiful source of inspiration and wonderful examples of professionally designed diagrams, flowcharts, UML diagrams, organizational charts, databases, ERDs, network diagrams, business charts, different thematic charts, schematics, infographics and plans developed specially for knowledge workers, engineers, managers, businessmen, marketing specialists, analytics, scientists, students, professors, journalists and also for a large number of other people that every day use various diagrams and drawings in their work and life activity. Each of these examples is a real art, all they are well thought-out and designed without efforts with help of powerful tools of ConceptDraw DIAGRAM software. ConceptDraw examples display all variety of tasks, possibilities and results that ConceptDraw Product Line lets achieve fast and easy. ConceptDraw is one of the best Visio alternatives for Mac. It open all Visio formats like.vsdx,.vss,.vdx files and allows you to export files to Visio formats.
What is ConceptDraw OFFICE

Healthcare, Health, biomedicine, Anatomy, Pharmacy, Medical Health Package

Healthcare, Health, biomedicine, Anatomy, Pharmacy, Medical
Health Package is a set of multifaceted solutions intended for visualization and illustration in a field of medicine and health, for drawing colorful, interesting and precise illustrations and infographics that will be used successfully in medical documents, articles, special magazines, posters, billboards, websites, presentations, collages. Having these solutions available, it will not be difficult to illustrate the medical editions, to convey the information in a full and interesting form, to teach students with use effective visual methods, to describe the medical facts, to tell about innovations in a field of medicine, health and correct nutrition, to explain the causes and consequences of different diseases, as well as the measures of their prevention and treatment.

Business Process Mapping — How to Map a Work Process

ConceptDraw DIAGRAM is a world-class diagramming platform that lets you display, communicate, and present dynamically. It′s powerful enough to draw everything from basic flowcharts to complex engineering schematics. Video tutorials on ConceptDraw products. Try it today!

Diagramming Software for Design UML Timing Diagrams

UML Timing Diagram as special form of a sequence diagram are used to explore the behaviors of objects throughout a given period of time.

SWOT Analysis

The success of the company depends on how successfully it is able to react on different outside influences. When analyzing the external situation, it is necessary to identify the factors most significant on a specified period of time. An interrelated consideration of these factors with the company's possibilities allows to solve effectively appearing problems. One of the most common methods of assessment together internal and external factors influencing the company's development is a SWOT analysis. SWOT analysis (acronym composed of the first letters of the words: strength, weakness, opportunities, threats) is one of the most common and effective types of analysis in marketing and marketing researches. It allows to identify and structure the strengths and weaknesses of an enterprise, as well as potential opportunities and threats of the market, to make conclusion in which direction a given organization needs to develop its business and to formulate the organization's strategy. Use the ConceptDraw MINDMAP software and offered SWOT analysis templates for easy holding SWOT analysis for your company. This Mind Map displays the SWOT analysis for a company and variety of performance measures that influence its work.

Basic Flowchart Symbols and Meaning

Flowcharts are the best for visually representation the business processes and the flow of a custom-order process through various departments within an organization. ConceptDraw DIAGRAM diagramming and vector drawing software extended with Flowcharts solution offers the full set of predesigned basic flowchart symbols which are gathered at two libraries: Flowchart and Flowcharts Rapid Draw. Among them are: process, terminator, decision, data, document, display, manual loop, and many other specific symbols. The meaning for each symbol offered by ConceptDraw gives the presentation about their proposed use in professional Flowcharts for business and technical processes, software algorithms, well-developed structures of web sites, Workflow diagrams, Process flow diagram and correlation in developing on-line instructional projects or business process system. Use of ready flow chart symbols in diagrams is incredibly useful - you need simply drag desired from the libraries to your document and arrange them in required order. There are a few serious alternatives to Visio for Mac, one of them is ConceptDraw DIAGRAM. It is one of the main contender with the most similar features and capabilities.
How to Build a Flowchart

Types of Flowcharts

A Flowchart is a graphical representation of process, algorithm, workflow or step-by-step solution of the problem. It shows the steps as boxes of various kinds and connects them by arrows in a defined order depicting a flow. There are twelve main Flowchart types: Basic Flowchart, Business Process Modeling Diagram (BPMN), Cross Functional Flowchart, Data Flow Diagram (DFD), IDEF (Integrated DEFinition) Flowchart, Event-driven Process Chain (EPC) Diagram, Influence Diagram (ID), Swimlane Flowchart, Process Flow Diagram (PFD), Specification and Description Language (SDL) Diagram, Value Stream Mapping, Workflow Diagram. Using the Flowcharts solution from the Diagrams area of ConceptDraw Solution Park you can easy and quickly design a Flowchart of any of these types. This solution offers a lot of special predesigned vector symbols for each of these widely used notations. They will make the drawing process of Flowcharts much easier than ever. Pay also attention for the included collection of ready Flowchart examples, samples and quick-start templates. This is business process improvement tools. If you are looking for MS Visio for your Mac, then you are out of luck, because it hasn't been released yet. However, you can use Visio alternatives that can successfully replace its functions. ConceptDraw DIAGRAM is an alternative to MS Visio for Mac that provides powerful features and intuitive user interface for the same.
How to Simplify Flow Charting

Remote Projects in Corporate Strategy

Communication is the main challenge and the key success factor for organizational project management in company with remote projects. Communicating visually via Skype you bring all projects together to achieve corporate goals.

Basic Audit Flowchart. Flowchart Examples

This sample shows the Audit Process Flowchart. It was created in ConceptDraw DIAGRAM diagramming and vector drawing software using the Flowcharts solution from the Diagrams area of ConceptDraw Solution Park. The Audit Flowcharts are widely used in the financial management, accounting, money management and in many others fields.