This site uses cookies. By continuing to browse the ConceptDraw site you are agreeing to our Use of Site Cookies.

healthcare workflow diagram, healthcare workflow, healthcare workflow management, workflow analysis healthcare, clinical workflows in healthcare Healthcare Management Workflow Diagrams

healthcare workflow diagram, healthcare workflow, healthcare workflow management, workflow analysis healthcare, clinical workflows in healthcare
Healthcare Management Workflow Diagrams solution contains large set of colorful samples and libraries with predesigned vector pictograms and symbols of health, healthcare equipment, medical instruments, pharmaceutical tools, transport, medication, departments of healthcare organizations, the medical icons of people and human anatomy, as well as the predesigned flowchart objects, connectors and arrows, which make it the best for designing clear and comprehensive Medi?al Workflow Diagrams and Block Diagrams, Healthcare Management Flowcharts and Infographics, Healthcare Workflow Diagram, for depicting the healthcare workflow and clinical workflows in healthcare, for making the workflow analysis healthcare and healthcare workflow management.

pvc pipe furniture plans, pvc pipe plans, plumbing plans examples, How to read plumbing plans? plumbing floor plan, plumbing layout plan, half pipe plans, pipe bender plans, plumbing plan symbols Plumbing and Piping Plans

pvc pipe furniture plans, pvc pipe plans, plumbing plans examples, How to read plumbing plans? plumbing floor plan, plumbing layout plan, half pipe plans, pipe bender plans, plumbing plan symbols
Plumbing and Piping Plans solution extends ConceptDraw DIAGRAM.2.2 software with samples, templates and libraries of pipes, plumbing, and valves design elements for developing of water and plumbing systems, and for drawing Plumbing plan, Piping plan, PVC Pipe plan, PVC Pipe furniture plan, Plumbing layout plan, Plumbing floor plan, Half pipe plans, Pipe bender plans.
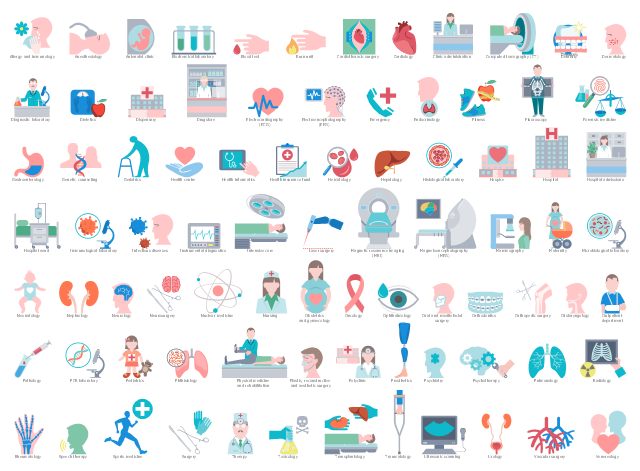
The vector stencils library "Healthcare departments" contains 85 medical department icons.
Use it to design your healthcare workflow diagrams, flowcharts and infographics with ConceptDraw PRO software.
"Hospitals consist of departments, traditionally called wards, especially when they have beds for inpatients, when they are sometimes also called inpatient wards. Hospitals may have acute services such as an emergency department or specialist trauma centre, burn unit, surgery, or urgent care. These may then be backed up by more specialist units such as the following:
* Emergency department,
* Cardiology,
* Intensive care unit,
* Neurology,
* Oncology,
* Obstetrics and gynaecology...
In addition, there is the department of nursing...
Some hospitals have outpatient departments and some have chronic treatment units such as behavioral health services, dentistry, dermatology, psychiatric ward, rehabilitation services, and physical therapy.
Common support units include a dispensary or pharmacy, pathology, and radiology. On the non-medical side, there often are medical records departments, release of information departments, information management, clinical engineering, facilities management, plant ops, dining services, and security departments." [Hospital. Wikipedia]
The hospital wards icons example "Design elements - Healthcare departments" is included in Healthcare Workflow Diagrams solution from Business Processes area of ConceptDraw Solution Park.
Workflow shapes
Workflow shapes, venereology, vascular surgery, urology, ultrasonic scanning, ultrasound diagnostic, traumatology, transplantology, toxicology, therapy, therapist, surgery, surgical Instruments, surgeon operating tools, sports medicine, speech therapy, rheumatology, radiology, roentgen, pulmonology, lungs, psychotherapy, psychiatry, prosthetics, polyclinic, plastic, reconstructive and aesthetic surgery, pill bottle, physical medicine and rehabilitation, physical therapy, phthisiology, pediatrics, pathology, outpatient department, otolaryngology, orthopedic surgery, orthodontics, oral and maxillofacial surgery, ophthalmology, oncology, obstetrics and gynaecology, gynaecology, nursing, nuclear medicine, neurosurgery, neurology, nephrology, neonatology, pediatrics, microbiological laboratory, maternity, mammography, mammogram, magnetoencephalography, MEG, lung, laser surgery, intensive care, operating room, instrumental diagnostics, infectious diseases, immunological laboratory, hospital ward, hospital admissions, hospital, hospice, histological laboratory, hepatology, liver, hematology, heart, health insurance fund, health informatics, health centre, hand, geriatrics, genetic counseling, gastroenterology, forensic medicine, fluoroscopy, radiology, roentgen, fitness, endocrinology, emergency, electroencephalography, eeg, electrocardiography, ecg, drugstore, pharmacy, drug, drawing shapes, dispensary, dietetics, diagnostic laboratory, dermatology, dentures, false teeth, dentistry, computed tomography, CT scanner, CT, clinic administration, cardiothoracic surgery, cardiology, burn unit, brain, blood test, blood drop, biochemical laboratory, antenatal clinic, anesthesiology, allergy, immunology, PCR laboratory, Magnetic resonance imaging, MRI, MRI scanner,

Local area network (LAN). Computer and Network Examples

Local Area Network (LAN) is a network which consists of computers and peripheral devices connected each other and to the local domain server, and covers a little territory or small number of buildings, such as home, school, laboratory, office, etc. LAN serves for few hundreds of users. It includes many cables and wires, and demands to design previously a Network diagram. All local area network devices can use the shared printers and disk storage. ConceptDraw DIAGRAM is a perfect network diagramming software with examples of LAN Diagrams, templates and predesigned vector objects. ConceptDraw DIAGRAM is the ideal choice for network engineers and network designers who need to draw fast and easy Local Area Network Diagrams, for IT specialists, developers and other IT professionals which need to visualize the communication schemes of LAN and visually document the LAN's physical structure and arrangement in houses, offices and other buildings. Ready-to-use vector objects from Computer Network Diagrams solution will help you design LAN diagrams in minutes.
How to Draw a Computer Network

Design Pictorial Infographics. Design Infographics

In the course of recent decades data visualization went through significant development and has become an indispensable tool of journalism, business intelligence and science. The way visual information may be conveyed is not limited simply to static or dynamic representation, it can also be interactive. Infographics can be conditionally divided into several general levels. Primarily, this is level of visualization of information, its interpretation and association on any ground. Second level can be defined as a visualization of knowledge, depiction of thoughts and ideas in the form of images or diagrams. Finally, the level of data visualization, which processes data arrays in charts, enabling the information to be more clearly perceived. You can also identify the main approaches to the creation of infographics: exploratory and narrative. Exploratory method insists on minimalist design in favor of data precision without unnecessary details and is common for scientific researches and ana

Tree Network Topology Diagram

A Tree network topology (Hierarchical topology) is a hybrid network topology that contains the combination of two or more star networks connected via bus networks. Each star network is a LAN (local area network) with central computer or server and workstation nodes connected to it. The central computers of star networks are connected to a main cable that is called a bus. Each node of the Tree network can have an arbitrary number of child nodes, you can easy add/remove the separate workstations and even the whole star networks, the failure of one workstation will not affect the work of others. This topology is ideal solution when workstations are located in groups within a small physical region, rarely is used in WAN configurations. Computer and Networks solution from Computer and Networks area of ConceptDraw Solution Park contains templates, samples and numerous libraries of predesigned vector stencils of computer network devices and equipment, which can be effectively used for designing various network topologies diagrams, including Tree Network Topology.

Healthcare, Health, biomedicine, Anatomy, Pharmacy, Medical Health Package

Healthcare, Health, biomedicine, Anatomy, Pharmacy, Medical
Health Package is a set of multifaceted solutions intended for visualization and illustration in a field of medicine and health, for drawing colorful, interesting and precise illustrations and infographics that will be used successfully in medical documents, articles, special magazines, posters, billboards, websites, presentations, collages. Having these solutions available, it will not be difficult to illustrate the medical editions, to convey the information in a full and interesting form, to teach students with use effective visual methods, to describe the medical facts, to tell about innovations in a field of medicine, health and correct nutrition, to explain the causes and consequences of different diseases, as well as the measures of their prevention and treatment.

Classroom Layout

You need design the Classroom Layout for the school, high-school, university? Now it's incredibly easy to do this in ConceptDraw DIAGRAM software which was supplied with School and Training Plans Solution from the Building Plans Area.

Computer Network Architecture. Computer and Network Examples

The network architecture and design specialization will help you gain the technical leadership skills you need to design and implement high-quality networks that support business needs.

logistics management Logistic Dashboard

logistics management
The powerful tools of Logistic Dashboard solution and specially developed live graphic objects of logistic icons, logistic navigation elements, logistic indicators, logistic charts and logistic maps effectively assist in designing Logistic dashboards, Logistic maps, Logistic charts, diagrams and infographics. The included set of prebuilt samples and quick-start templates, demonstrates the power of ConceptDraw DIAGRAM software in logistics management, its assisting abilities in development, realization and analyzing the logistic processes, as well as in perfection the methods of logistics management.

How to Create Flowcharts for an Accounting Information System

Accounting information is a system of interrelated processes which represent financial and accounting data, required for decision making. For representing the accounting processes in a visual and easy for perception form are constructed Accounting Flowcharts. For their creation are used special flowchart symbols, this makes Accounting flowcharts understandable for all users of accounting information system and helps them easy understand the sequence of steps involved to accounting processes. But how to create Flowcharts for an Accounting Information System fast and easy? Use of special design software is useful for this. ConceptDraw DIAGRAM software extended with Accounting Flowcharts solution is the best for creation accurate Accounting Flowcharts, for documentation and visually communication on how accounting processes work, how each operation is done. Accounting Flowcharts solution is supplied with library of predesigned commonly used vector symbols, Accounting Flowchart templates and samples demonstrating receiving, purchasing, payment, and other accounting processes.

Maps and Directions

ConceptDraw DIAGRAM diagramming and vector drawing software extended with Directional Maps Solution from the Maps Area of ConceptDraw Solution Park is a powerful maps and directions design software. Let's review the tools of this solution.

Emergency Plan

The Fire Emergency Plan illustrates the scheme of the building and location of the main and fire exits for a safe evacuation, and clearly defines directions to them on the plan. Fire Emergency Plans are constructed on the case of unexpected or emergency situations, fires, hazardous leaks, natural disasters, and other sudden events. They must to be obligatorily on the plain sight at every building and on each floor, at living houses and apartments, schools and universities, medical centers, clinics and hospitals, office buildings, banks, cafes, restaurants, and also at all other public buildings and institutions. The Evacuation plans and Emergency Plans preliminary designed in ConceptDraw DIAGRAM software help employees and family members when some emergency events happen and let avoid the accidents and sad consequences, prevent injuries and fatalities, allow reduce damages and speed the work resumption. Start drawing emergency blueprint from floor bounds, then add the inner walls and doors, and finally use bright arrows to visually show evacuation directions to fire exits. ConceptDraw is a serious alternative to Visio. It's a desktop based solution aimed at professional designers working in CAD environments. It is also a good option for those who work between Mac and PC because one license is valid for both.
How to Draw a Floor Plan

Data Flow Diagram

Data Flow Diagram (DFD) is the part of the Structured Systems Analysis and Design Methodology (SSADM), which is intended for information systems projection and analysis. Data Flow Diagrams allow graphically represent the data flows in information system and analyze the data processing during the structural projection. This type of diagrams lets visually show a work of information system and results of this work, it is often used in connection with human processes and can be displayed as Workflow diagram. Data Flow Diagram visualizes processes and functions, external entities, data depositories, and data flows connecting these elements and indicating direction and data character. Each of these elements used for DFD has its own graphical notation. There are two notations to draw DFDs - Yourdon & Coad and Gane & Sarson. ConceptDraw DIAGRAM extended with Data Flow Diagrams (DFD) solution from Software Developmant area is ideal for designing professional looking DFDs, which can be then easily exported in various formats.

Fire Exit Plan

ConceptDraw DIAGRAM extended with Fire and Emergency Plans solution from the Building Plans area of ConceptDraw Solution Park lets you make a Fire Exit Plan of any complexity in minutes.

Infographic Maker

Infographic is a visual way of representing various information, data, knowledge in statistics, geography, journalism, education, and much more areas. ConceptDraw DIAGRAM supplied with Pictorial Infographics Solution from the “Infographics” Area, provides a set of powerful pictorial infographics tools. Thanks to them it is the best Infographic Maker.

health science, allied health, public health, internal medicine Health Sciences

health science, allied health, public health, internal medicine
Health Sciences solution including professionally designed samples and wide range of high-quality vector icons and pictograms of basic medical sciences, surgery specializations, internal medicine, medical diagnostics, interdisciplinary fields, mental health, obstetrics and gynecology, public health, allied health, and other medical specialties, is a perfect assistant in drawing Health diagrams, schematics, illustrations, infographics and slides for presentations on the healthcare, medical and health sciences thematic, in development knowledge in health science, in studying and representing the physical, mental and social aspects of human health, in determining the role of different health sciences at this process, finding and explaining new methods of treatment different diseases, making an overview and describing the main characteristics of health sciences in a visual form.
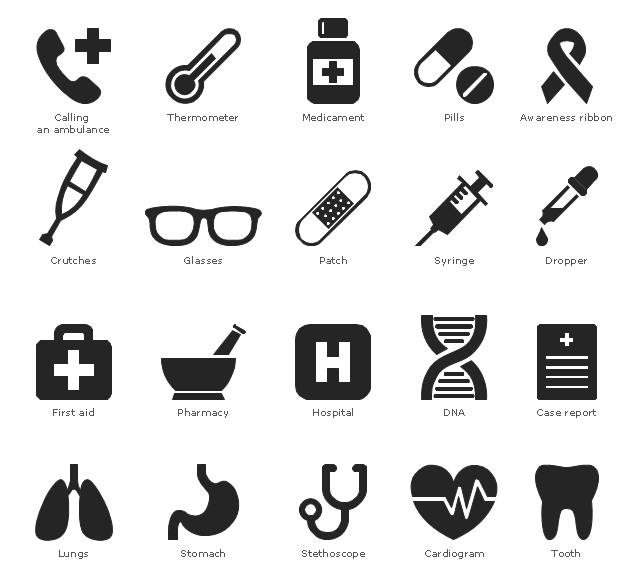
The vector stencils library "Medicine and health pictograms" contains 20 medicine and health pictograms.
Use it to draw your medical and healthcare infographics.
The example "Design elements - Medicine and health pictograms" was created using the ConceptDraw PRO diagramming and vector drawing software extended with the Pictorial Infographic solution from the area "What is infographics" in ConceptDraw Solution Park.
Medical pictograms
Medical pictograms, tooth, thermometer, temperature, syringe, stomach, stethoscope, phonendoscope, pills, pharmacy, patch, plaster, medicament, remedy, preparation, cure, lungs, hospital, glasses, eyeglasses, first aid, echocardiography, cardiogram, heart, dropper, pipette, crutches, case report, medical report, calling an ambulance, awareness ribbon, DNA,

How to Draw an Organization Chart

An Organizational chart is a type of diagram which visually displays the structure of an organization, relationships and relative ranks of the organization′s parts and positions. Organizational chart is constructed as an hierarchical structure, in the form of tree. How to Draw an Organization Chart the most easy and quickly? The Organizational Charts solution, innovative Tree Auto-connection mode and ConceptDraw Arrows10 Technology included in ConceptDraw DIAGRAM software are powerful drawing tools that change the way of diagrams production. Arrows10 Technology provides smart behavior for the connectors, and so quick and precise placement when drawing, and lets easy make the changes and automatic rearrangement. It helps to make the process of drawing diagrams more efficient, easier and faster. Now, you don′t need to think on how to connect or place the objects, you can concentrate fully on what to draw. See obligatory the helpful video tutorial about creation the Organization Charts and orgchart professional presentations with ConceptDraw products.