Seven Basic Tools of Quality - Histogram

Histogram Chart

Make a Histogram

 Seven Basic Tools of Quality
Manage quality control in the workplace, using fishbone diagrams, flowcharts, Pareto charts and histograms, provided by the Seven Basic Tools of Quality solution.
How To Make Histogram in ConceptDraw PRO?

Seven Basic Tools of Quality - Fishbone Diagram

Histogram

Total Quality Management Value

Seven Basic Tools of Quality — Quality Control

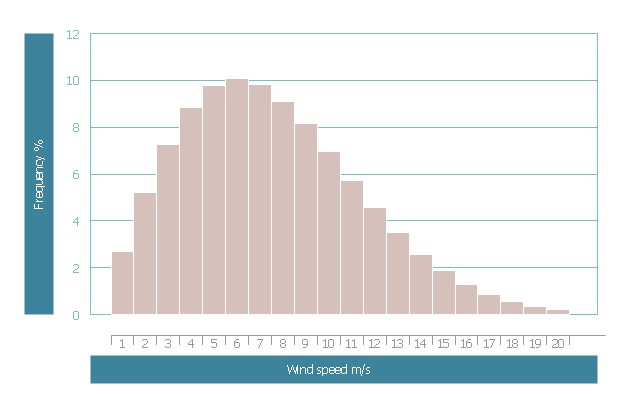
This wind speed frequency distribution histogram example was redesigned from the Wikimedia Commons file: Frekvensfördelning.jpg.
[commons.wikimedia.org/ wiki/ File:Frekvensf%C3%B6rdelning.jpg]
This file is licensed under the Creative Commons Attribution-Share Alike 3.0 Unported license. [creativecommons.org/ licenses/ by-sa/ 3.0/ deed.en]
Example of frequency distribution of wind speed. Each bar represents the range of 1 m / s. Over 10 percent of the time the wind blows from 5.5 to 6.5 m / s, which is the most common wind speed. The mean wind speed is 7 m / s. [Vindkraft. Swedish Wikipedia]
The example "Wind speed histogram" was created using the ConceptDraw PRO software extended with the Seven Basic Tools of Quality solution from the Quality area of ConceptDraw Solution Park.
Histogram example
Affinity Diagram Software

 Histograms
How to make a Histogram? Making a Histogram is an incredibly easy process when it is done with ConceptDraw PRO. The Histograms Solution enhances ConceptDraw PRO v10 functionality with extensive drawing tools, numerous samples, and examples; also a quick-start template and library of ready vector stencils for visualization the data and professional drawing Histograms.
 Basic Histograms
This solution extends the capabilities of ConceptDraw PRO v10.3.0 (or later) with templates, samples and a library of vector stencils for drawing Histograms.
The vector stencils library "Process flowchart" contains 9 flow chart symbols.
Use it to design your process flowcharts with ConceptDraw PRO diagramming and vector drawing software.
"A flowchart is a type of diagram that represents an algorithm, workflow or process, showing the steps as boxes of various kinds, and their order by connecting them with arrows. ...
Kaoru Ishikawa defined the flowchart as one of the seven basic tools of quality control, next to the histogram, Pareto chart, check sheet, control chart, cause-and-effect diagram, and the scatter diagram. ...
Common alternative names include: flowchart, process flowchart, functional flowchart, process map, process chart, functional process chart, business process model, process model, process flow diagram, work flow diagram, business flow diagram. The terms "flowchart" and "flow chart" are used interchangeably." [Flowchart. Wikipedia]
The example of flow chart symbols "Design elements - Process flowchart" is included in the Seven Basic Tools of Quality solution from the Quality area of ConceptDraw Solution Park.
Process flowchart symbols

- Seven Basic Tools of Quality - Histogram | Histogram | How Do You ...
- 7 Tools For Quality Example
- Seven Basic Tools of Quality - Quality Control | Histogram 7qc With ...
- Seven Basic Tools of Quality - Histogram | Seven Basic Tools of ...
- Seven Basic Tools of Quality - Histogram | How to Draw a Histogram ...
- Seven Basic Tools of Quality - Histogram | Histogram | How To Make ...
- Seven Basic Tools of Quality | Histograms | Basic Histograms ...
- Seven Basic Tools of Quality - Histogram | Histograms | Basic ...
- Seven Basic Tools of Quality - Histogram | Histograms | Making a ...
- Seven Basic Tools of Quality - Histogram | Histogram example - Age ...
- Histogram | Seven Basic Tools of Quality - Flow Chart | Histogram ...
- Seven Basic Tools of Quality - Quality Control | How To Make ...
- Histogram | Seven Basic Tools of Quality - Flow Chart | Seven Basic ...
- Design elements - Histogram
- Seven Basic Tools of Quality - Histogram | Histogram | Making a ...
- Seven Basic Tools of Quality - Histogram | How Do You Make a ...
- Making a Histogram | Histogram | Seven Basic Tools of Quality ...
- Histogram Chart | Making a Histogram | Best Program to Make ...
- Seven Basic Tools of Quality - Histogram | Histogram Chart | How to ...
- Stratification Run Chart Tool Of Quality