This site uses cookies. By continuing to browse the ConceptDraw site you are agreeing to our Use of Site Cookies.

scrum, agile methodology, scrum methodology, scrum board Scrum Workflow

scrum, agile methodology, scrum methodology, scrum board
The Scrum Workflow Solution extends the capabilities of ConceptDraw DIAGRAM with a large collection of professionally-designed samples and a selection of ready-to-use scrum design elements: scrum diagrams and arrows, scrum icons of people, artifacts, workflow, workspace and other colorful scrum clipart, and also scrum charts.
HelpDesk

How to Create an IDEF0 Diagram for an Application Development

IDEF0 methods are intended to model the functions of a process, creating a graphical model that displays: what controls the function, who makes it, what resources are used and how they are connected with other functions. The IDEF0 tool is used to model the decisions, actions, and activities of a software system during the development process. IDEF0 diagram graphically depicts a model of a desired version of the application. ConceptDraw DIAGRAM allows you to create and communicate the IDEF0 diagrams of any complexity.

Agile Methodology

Agile methodology is an excellent alternative to waterfall and traditional sequential development. ConceptDraw DIAGRAM software extended with SCRUM Workflow solution is ideal for quick and easy designing various diagrams, charts, mind maps and schematics illustrating software development using Agile methodologies, and in particular Scrum methodology.
HelpDesk

Agile Mind Maps: Exploring the User Wishes
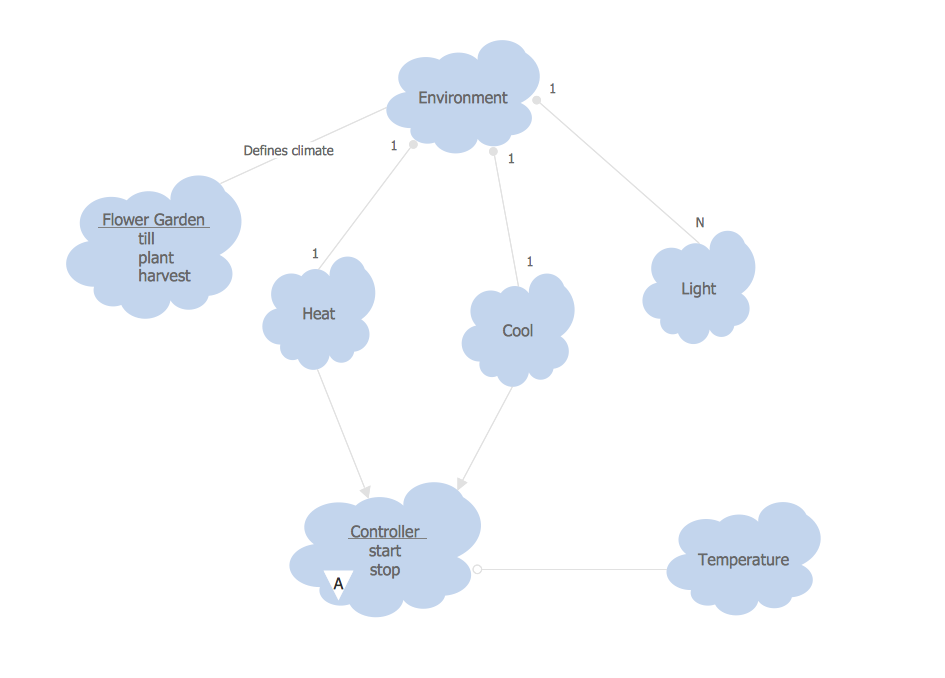
Agile method advocate use cases and user stories, but there are no standard processes or guides available to help gather user requirements. That is why documenting user requirements can be challenging. Without strong communication experience, the Scrum process can collapse, leading towards unfruitful requirements and imperfect software. This article offers a path to overcome these hurdles through the simplicity and clearness of mind mapping. ConceptDraw Scrum Workflow solution lets explore the user requirements for your Agile development project before they are formalized. You can easily create professional Mind Maps that will effectively collect and structure the information on what a user actually wants, or the User Wish.

Data Flow Diagram

Data flow diagram (DFD) is the part of the SSADM method (Structured Systems Analysis and Design Methodology), intended for analysis and information systems projection. Data flow diagrams are intended for graphical representation of data flows in the information system and for analysis of data processing during the structural projection. Data flow diagram often used in connection with human process and can be displayed as workflow diagram. The critical Process Flow Diagram is another flowchart technique for designing data flow in connection with organizational processes. The critical Process flow diagram may use different range of symbols than a classic workflow diagram.

Structured Systems Analysis and Design Method (SSADM) with ConceptDraw DIAGRAM

Structured Systems Analysis and Design Method SSADM is the method which is used at projecting and analysis of information systems. SSADM is based on the data flow diagrams. At the description of data flows out of the system and into the system DFD, which denote boundaries of the system, are used.
HelpDesk

How to Create a Release Burn-Down Chart

The Agile methodology provides project teams the ability to quickly adapt the project to the current situation and thus achieve maximum productivity. According to the Scrum method, the steps needed to fulfill the project goal breaks down by using short sprints or iterations. The iterations together with an extensive collaboration can increase productivity by better understanding the entire flow of a project. A release burn-down chart is used to track progress on a Scrum project. The ConceptDraw Scrum Workflow Solution makes it easy for Agile project team to build any professional Scrum diagram such as a Release velocity chart, Release burn-down chart, Sprint burn-down chart, or a Team velocity chart.

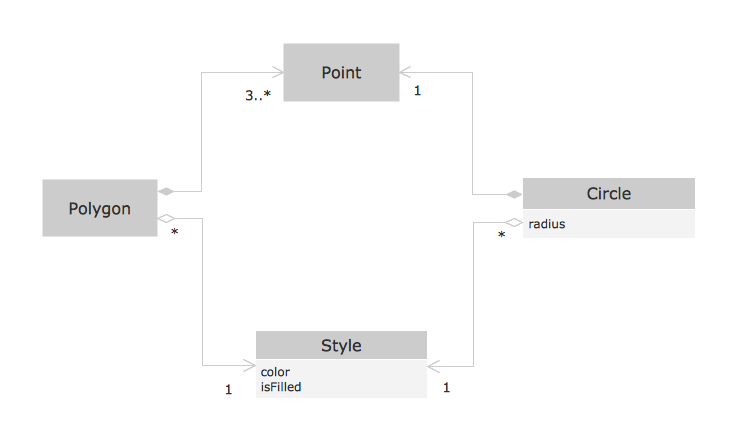
Object-Oriented Development (OOD) Method

This sample shows the Booch OOD diagram of the environment. The Booch method (developed by Grady Booch) is an object modeling language and methodology used in software engineering.
This sample was created in ConceptDraw DIAGRAM diagramming and vector drawing software using the Rapid UML Solution from the Software Development area of ConceptDraw Solution Park.
HelpDesk

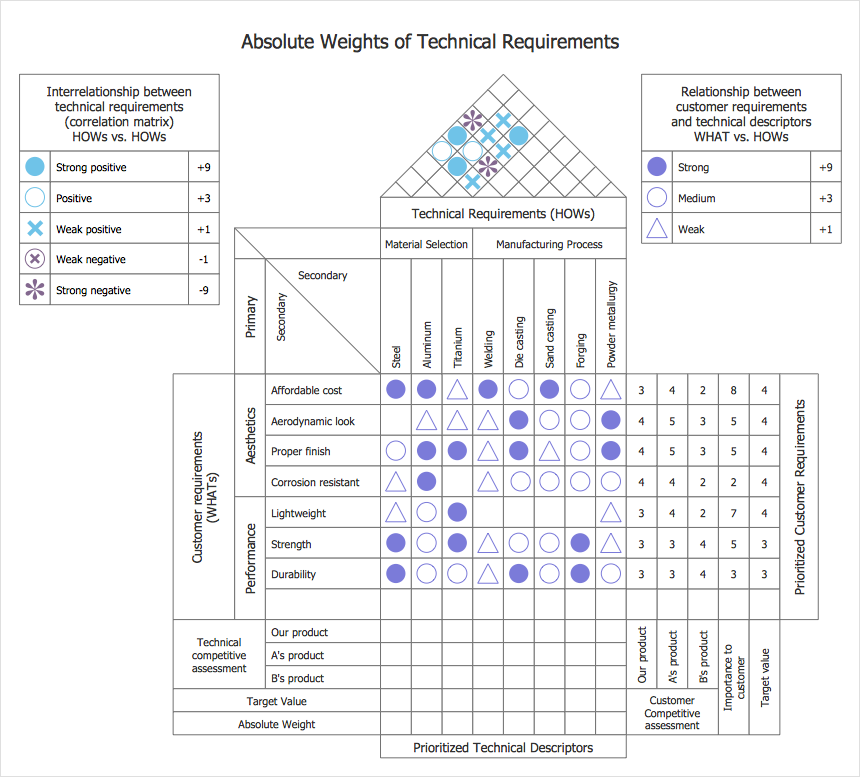
How to Create a House of Quality Diagram

The House of Quality diagram is a part of quality function deployment method (QFD) designed by Japanese planning specialists to help turn customer requirements (voice of the customer) into technical features of a final product. The House of Quality solution for ConceptDraw DIAGRAM is a tool for designing HOQ diagrams. There are 2 libraries containing 54 vector stencils you can use to create House of Quality diagrams of any type.

OOSE Method

This sample shows the OOSE diagram with aggregation and composition associations.
Using the Rapid UML Solution for ConceptDraw DIAGRAM you can create your own professional OOSE Diagrams quick and easy.