Network Topology Mapper

Keyboard Shortcuts and Mouse Actions

Process Flowchart


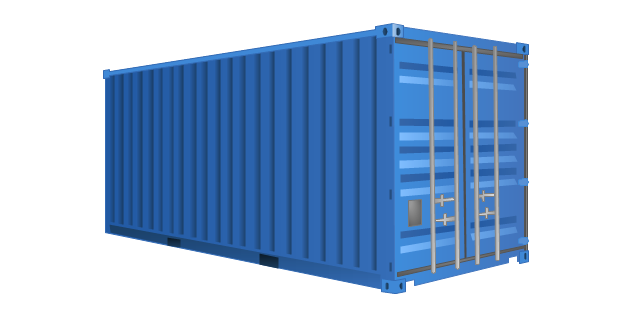
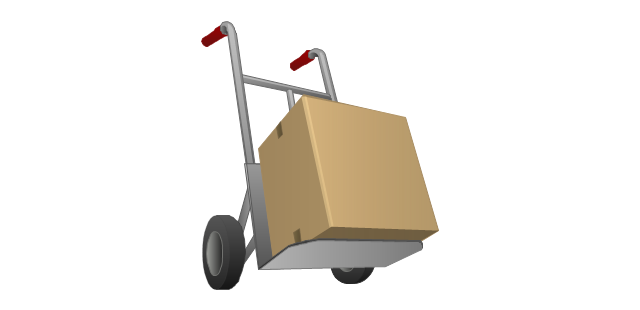
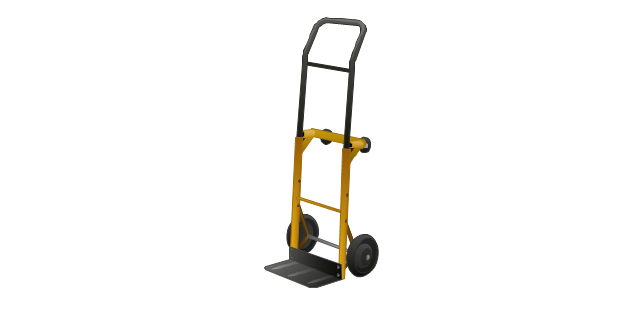
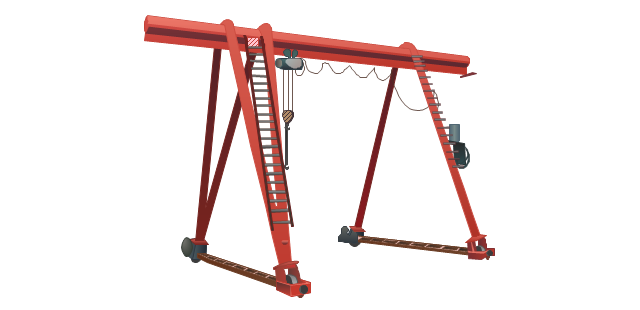
The vector stencils library "Packaging, loading, customs" contains 28 clipart images of packing materials and packaging equipment for drawing illustrations.
"Packaging is the technology of enclosing or protecting products for distribution, storage, sale, and use. Packaging also refers to the process of design, evaluation, and production of packages. Packaging can be described as a coordinated system of preparing goods for transport, warehousing, logistics, sale, and end use. Packaging contains, protects, preserves, transports, informs, and sells. In many countries it is fully integrated into government, business, institutional, industrial, and personal use." [Packaging and labeling. Wikipedia]
The clip art example "Packaging, loading, customs - Vector stencils library" was created in ConceptDraw PRO diagramming and vector drawing software using the Manufacturing and Maintenance solution from the Illustration area of ConceptDraw Solution Park.
Cardboard box

Cardboard box (open)
-packaging,-loading,-customs---vector-stencils-library.png--diagram-flowchart-example.png)
Paper bag

Woodgrain barrel

Barrel

Crate

Container
Handcart with cardboard box
Flatbed trolley

Hand truck
Porter

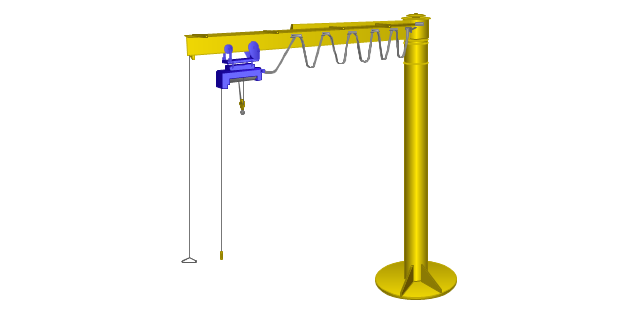
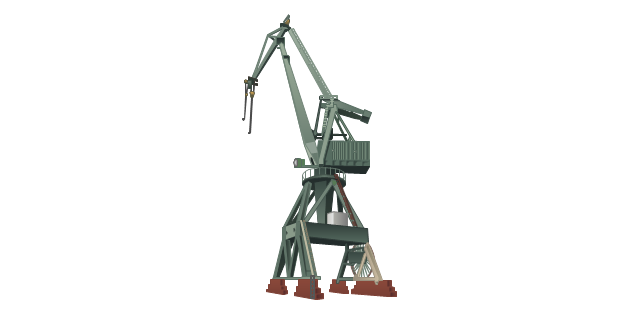
Gantry crane
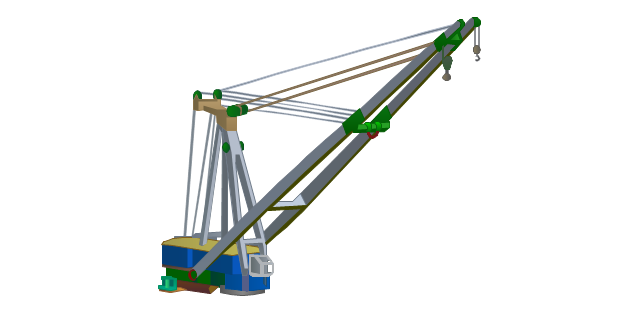
Jib crane
Level luffing crane
Deck crane
Packaging

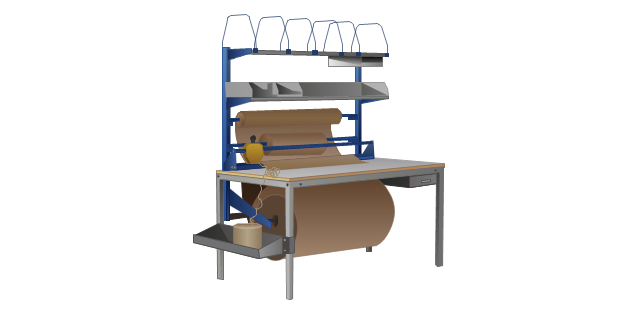
Packaging machine
Packing conveyor

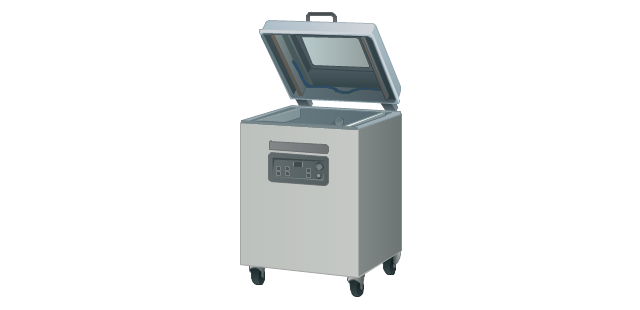
Vacuum packaging machine
State border sign

Border checkpoint
Customs sign

Border control

Port of entry office

Customs officer

Stocker with cardboard boxes

Warehouse workers

Pallet jack

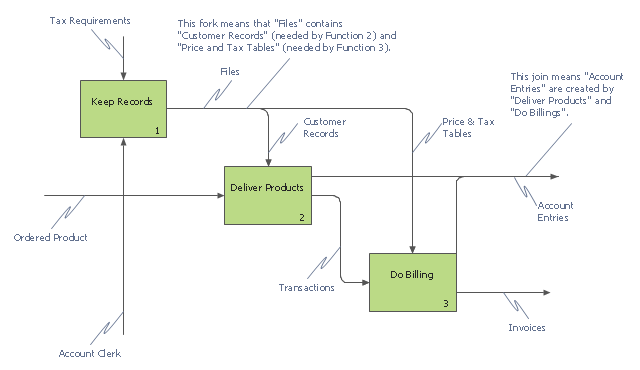
This IDEF0 diagram example was redesigned from the Wikimedia Commons file: 12 Connections Between Boxes.svg.
[commons.wikimedia.org/ wiki/ File:12_ Connections_ Between_ Boxes.svg]
"Graphical notation.
IDEF0 is a model that consists of a hierarchical series of diagrams, text, and glossary cross referenced to each other. The two primary modeling components are:
- functions (represented on a diagram by boxes), and
- data and objects that interrelate those functions (represented by arrows).
.... the position at which the arrow attaches to a box conveys the specific role of the interface. The controls enter the top of the box. The inputs, the data or objects acted upon by the operation, enter the box from the left. The outputs of the operation leave the right-hand side of the box. Mechanism arrows that provide supporting means for performing the function join (point up to) the bottom of the box." [IDEF0. Wikipedia]
The example "IDEF0 diagram - Inter-box connections" was created using the ConceptDraw PRO diagramming and vector drawing software extended with the solution "IDEF Business Process Diagrams" from the area "Business Processes" of ConceptDraw Solution Park.
IDEF0 business process diagram
Local area network (LAN). Computer and Network Examples
. Computer and Network Examples")

Cross-functional flowchart landscape, U.S. units

This example of a Top Level Context Diagram for an information system management process was redesigned from the Wikipedia file: IDEF Top-Level Context Diagram.jpg. [en.wikipedia.org/ wiki/ File:IDEF_ Top-Level_ Context_ Diagram.jpg]
"Graphical notation.
IDEF0 is a model that consists of a hierarchical series of diagrams, text, and glossary cross referenced to each other. The two primary modeling components are:
(1) functions (represented on a diagram by boxes), and
(2) data and objects that interrelate those functions (represented by arrows).
... the position at which the arrow attaches to a box conveys the specific role of the interface. The controls enter the top of the box. The inputs, the data or objects acted upon by the operation, enter the box from the left. The outputs of the operation leave the right-hand side of the box. Mechanism arrows that provide supporting means for performing the function join (point up to) the bottom of the box.
The IDEF0 process.
The IDEF0 process starts with the identification of the prime function to be decomposed. This function is identified on a “Top Level Context Diagram,” that defines the scope of the particular IDEF0 analysis. ... From this diagram lower-level diagrams are generated." [IDEF0. Wikipedia]
The IDEF0 diagram example "Top-level context diagram" was created using the ConceptDraw PRO diagramming and vector drawing software extended with the IDEF0 Diagrams solution from the Software Development area of ConceptDraw Solution Park.
IDEF0 diagram

Cross-Functional Flowchart


Create Soccer (Football) Positions
 Positions")
HelpDesk
How to Draw a Floor Plan for Your Office

Electrical Symbols, Electrical Diagram Symbols

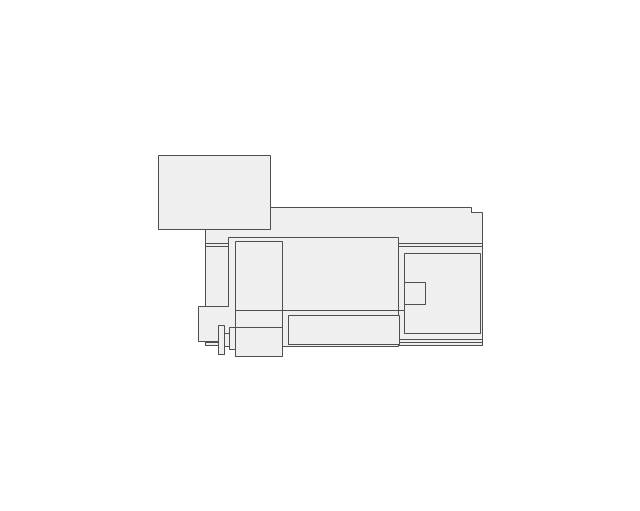
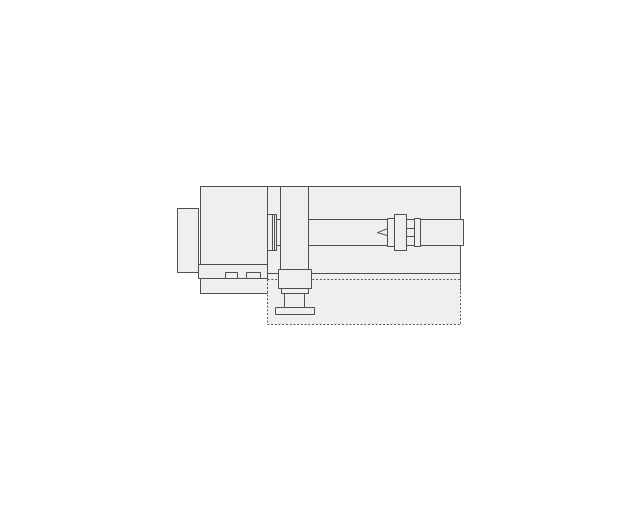
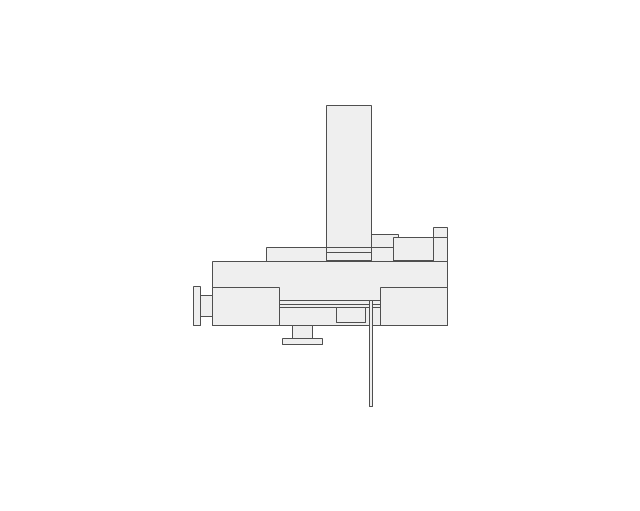
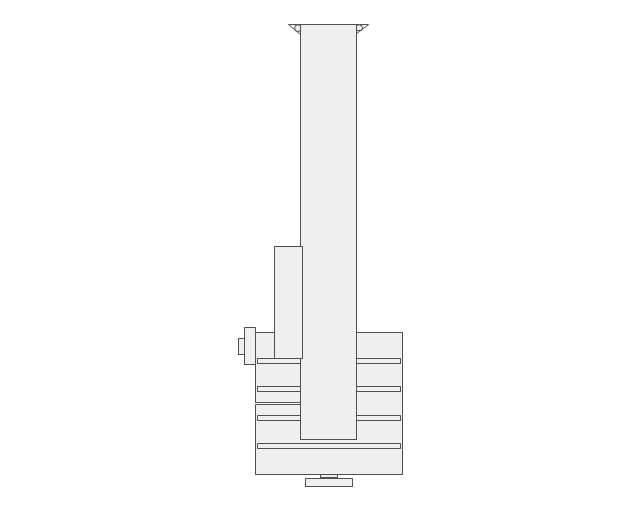
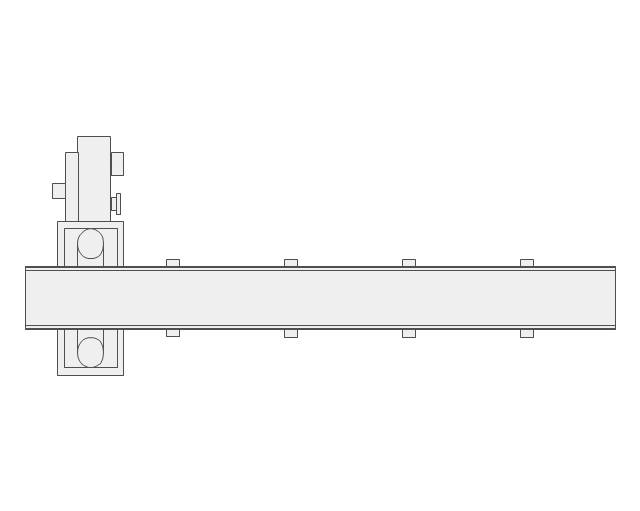
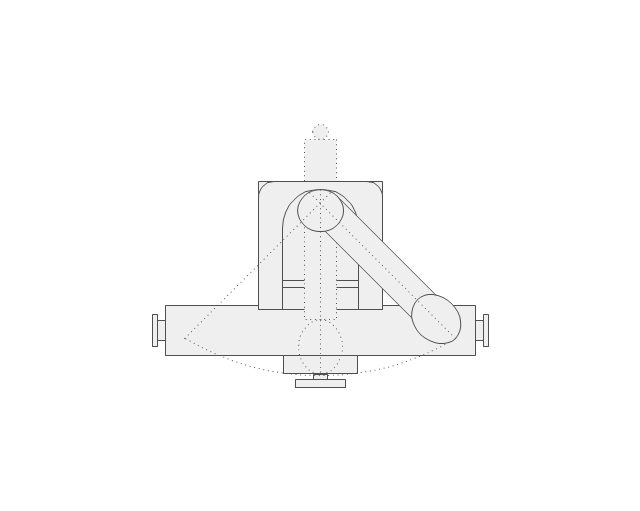
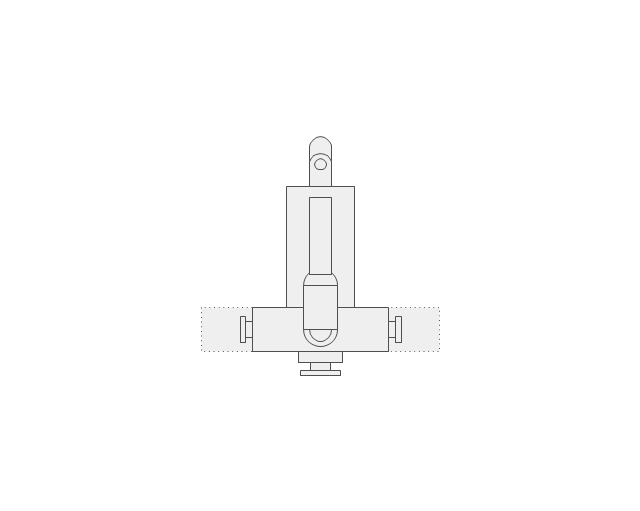
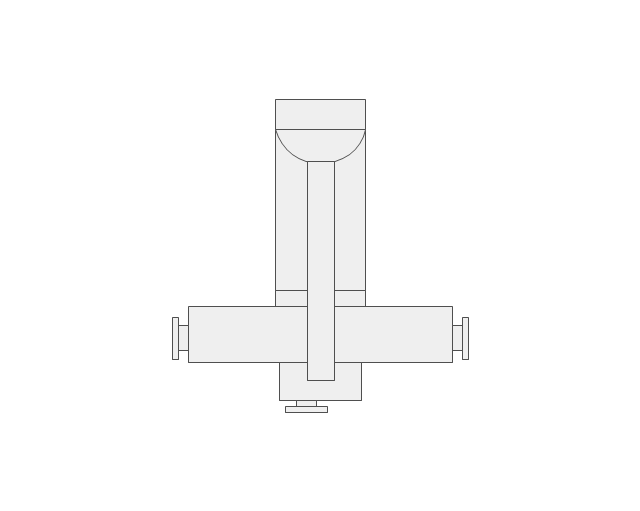
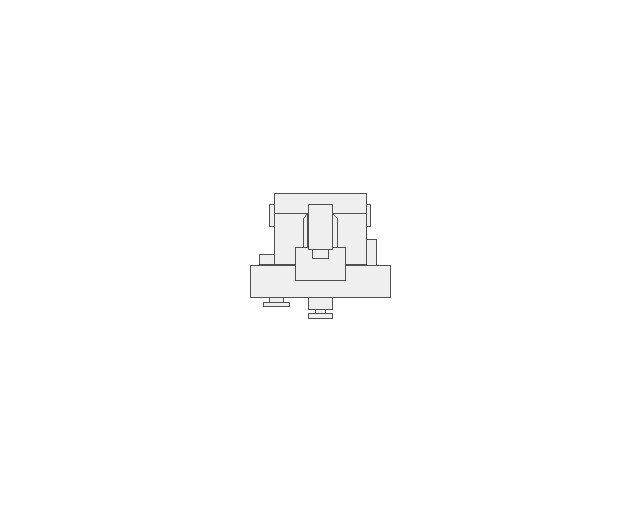
The vector stencils library "Machines and equipment" contains 24 shapes of industrial machines and equipment.
Use it for drawing plant floor plans and manufacturing warehouse layouts the ConceptDraw PRO diagramming and vector drawing software extended with the Plant Layout Plans solution from the Building Plans area of ConceptDraw Solution Park.
www.conceptdraw.com/ solution-park/ building-plant-layout-plans
Computer numerical control lathe
Centre lathe
Horizontal band saw
Vertical band saw
Sawing machine
Turret milling machine
Vertical milling machine
Horizontal milling machine
Surface grinder
Shaping machine

Folding machine
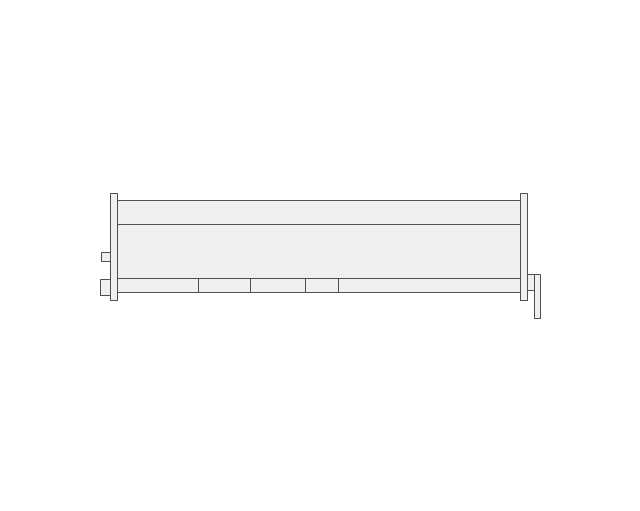
Shearing machine
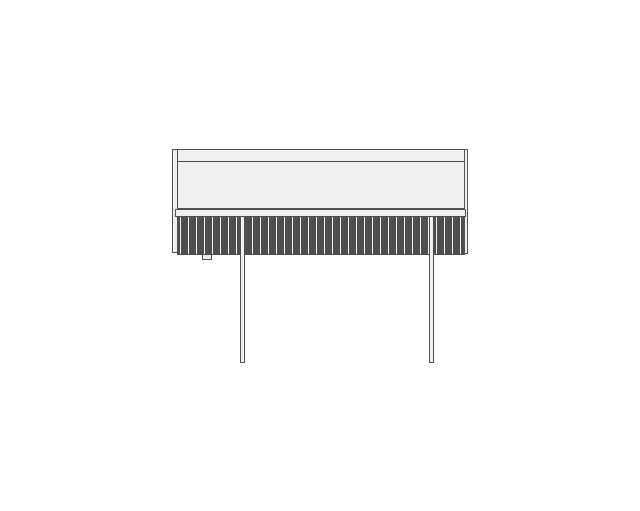
Hand roller press
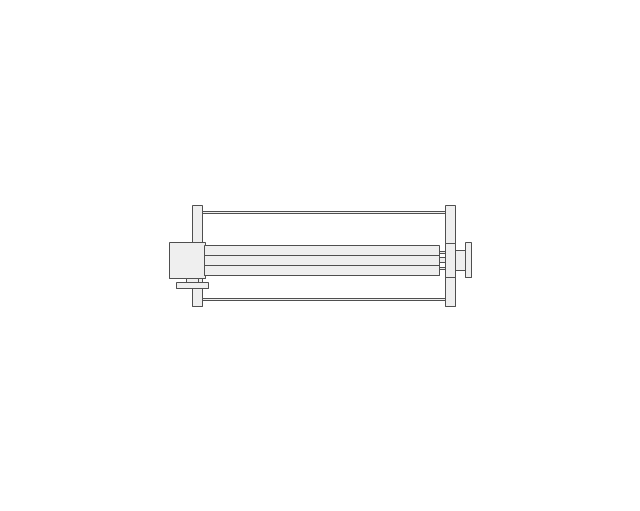
Drill press

Drilling machine
Tungsten inert gas welding

Metal inert gas welding

Generator

Compressor
Platform trolley

Mobile tool box

Fire extinguisher

First aid cabinet

Operator

 Word Exchange
This solution extends ConceptDraw MINDMAP software with the ability to quickly create the framework for a future article or book, fill the structure with ideas, and use it to produce an MS Word document with just a simple click of the mouse.
 Sales Flowcharts
The Sales Flowcharts solution lets you create and display sales process maps, sales process workflows, sales steps, the sales process, and anything else involving sales process management.
- IDEF0 diagram - Inter- box connections | VoIP call with SIM box and ...
- Design For Title Png
- How to Draw a Circular Arrows Diagram Using ConceptDraw PRO ...
- IDEF0 diagram - Inter- box connections | Top-level context diagram ...
- Message Png Iphone
- Design elements - Bulleted and numbered lists | Design elements ...
- Rectangle Design Png
- Design elements - Bulleted and numbered lists | Design elements ...
- Shopping Infographic Png
- Text Message Iphone Icon Png
- Sales Marketing Vector Png
- Paper Bag Png
- Design elements - Education list blocks | Design elements - List ...
- Shapes Stairs Png
- Vector Png Images
- Box Delivery Png
- Basic Flowchart Symbols and Meaning | Active Directory - Vector ...
- Design elements - List blocks | Design elements - Management list ...
- Basic Flowchart Symbols and Meaning | IDEF0 diagram - Inter- box ...
- Research onion diagram | Research cycle - Circle diagram | Best ...