 ConceptDraw Solution Park
ConceptDraw Solution Park collects graphic extensions, examples and learning materials
 Website Wireframe
The innovative Website Wireframe solution enhances the ConceptDraw DIAGRAM functionality with newest wireframe tools, libraries with variety of predesigned icons, symbols, buttons, graphics, forms, boxes, and many other vector elements, templates and professionally designed samples, which make it the best wireframing software. Website Wireframe solution gives you significant advantages when designing and maintaining websites, creating skeletal and content-free depictions of website structure, making website prototypes and planning the content arrangement before committing to design, also speeds up the processes of sketching, producing and sharing wireframe examples of website style and interface design.
This picture graph sample shows how does manufacturing compare with other industries in U.S. It was designed using data from the U.S. Census Bureau website. [census.gov/ how/ img/ manufacturing_ 2014_ th.jpg]
"Manufacturing is the production of merchandise for use or sale using labour and machines, tools, chemical and biological processing, or formulation. The term may refer to a range of human activity, from handicraft to high tech, but is most commonly applied to industrial production, in which raw materials are transformed into finished goods on a large scale. Such finished goods may be used for manufacturing other, more complex products, such as aircraft, household appliances or automobiles, or sold to wholesalers, who in turn sell them to retailers, who then sell them to end users and consumers." [Manufacturing. Wikipedia]
The arrows bar chart example "Manufacturing in America" was created using the ConceptDraw PRO diagramming and vector drawing software extended with the Picture Graphs solution from the Graphs and Charts area of ConceptDraw Solution Park.
Arrows bar chart

 Site Plans
The Site Plans solution extends ConceptDraw DIAGRAM with samples, templates and numerous libraries of design elements making it powerful site plan software, ideal for landscape drawing, designing Site Plans, Site Layout Plans, Landscape Design Drawings, Home Site Plans, Hotel Site Plans, Park Site Plans, for developing the residential and commercial landscape design drawings and site plan, parks planning, landscaping territories, lighting trails, for creating drainage facilities, yard layouts, plant maps, outdoor recreational facilities, and irrigation systems plans.
 AWS Architecture Diagrams
AWS Architecture Diagrams with powerful drawing tools and numerous predesigned Amazon icons and AWS simple icons is the best for creation the AWS Architecture Diagrams, describing the use of Amazon Web Services or Amazon Cloud Services, their application for development and implementation the systems running on the AWS infrastructure. The multifarious samples give you the good understanding of AWS platform, its structure, services, resources and features, wide opportunities, advantages and benefits from their use; solution’s templates are essential and helpful when designing, description and implementing the AWS infrastructure-based systems. Use them in technical documentation, advertising and marketing materials, in specifications, presentation slides, whitepapers, datasheets, posters, etc.
 Line Graphs
How to draw a Line Graph with ease? The Line Graphs solution extends the capabilities of ConceptDraw DIAGRAM with professionally designed templates, samples, and a library of vector stencils for drawing perfect Line Graphs.
 Bar Graphs
The Bar Graphs solution enhances ConceptDraw DIAGRAM functionality with templates, numerous professional-looking samples, and a library of vector stencils for drawing different types of Bar Graphs, such as Simple Bar Graph, Double Bar Graph, Divided Bar Graph, Horizontal Bar Graph, Vertical Bar Graph, and Column Bar Chart.
 Picture Graphs
Typically, a Picture Graph has very broad usage. They many times used successfully in marketing, management, and manufacturing. The Picture Graphs Solution extends the capabilities of ConceptDraw DIAGRAM with templates, samples, and a library of professionally developed vector stencils for designing Picture Graphs.
Basic Diagramming Flowchart Software

Example of DFD for Online Store (Data Flow Diagram)


ConceptDraw Solution Park
ConceptDraw Solution Park collects graphic extensions, examples and learning materials
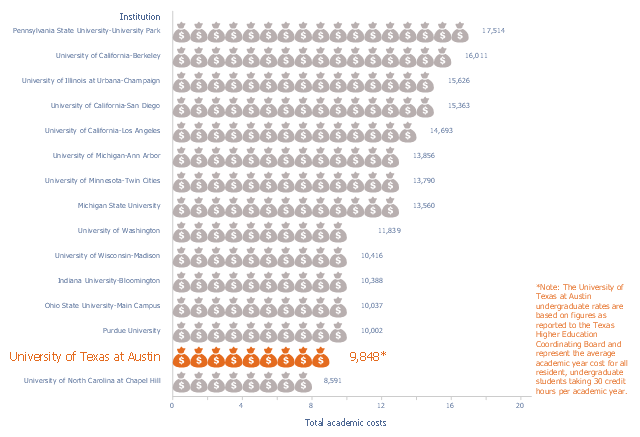
This picture bar graph sample shows the UT Austin Tuition Ranks 6th Compared to Other Texas Public Universities (Tuition and fees per semester, fall 2015). It was designed using data of the diagram "Compare UT Tuition" from the website of the University of Texas at Austin.
[tuition.utexas.edu/ compare]
The pictorial chart "Academic costs for residents, 2015-16" was created using the ConceptDraw PRO diagramming and vector drawing software extended with the Picture Graphs solution from the Graphs and Charts area of ConceptDraw Solution Park.
[tuition.utexas.edu/ compare]
The pictorial chart "Academic costs for residents, 2015-16" was created using the ConceptDraw PRO diagramming and vector drawing software extended with the Picture Graphs solution from the Graphs and Charts area of ConceptDraw Solution Park.
Pictorial chart
- Website Wireframe | Best Concept For Advertisements Charts
- Composition Dashboard | Pie Charts | Basic Diagramming | Drawing ...
- Business and Finance | Picture Graphs | Aerospace and Transport ...
- ConceptDraw Solution Park | Germany Map | Picture Graphs ...
- Page load time - Frequency histogram | Histogram Chart | Make a ...
- ConceptDraw Solution Park | Germany Map | Picture Graphs ...
- How to Draw a Histogram in ConceptDraw PRO | How Do You Make ...
- Picture Graphs | ConceptDraw Solution Park | Total Quality ...
- Picture Graphs | Network Architecture | AWS Architecture Diagrams ...
- Barrie population - Picture bar graph | Design elements - Picture ...
- Comparison Dashboard | Composition Dashboard | Marketing ...
- Picture Graphs | Aerospace and Transport | ConceptDraw Solution ...
- Picture Graphs | How to Create a Picture Graph in ConceptDraw ...
- Bar Graphs | Divided Bar Diagrams | ConceptDraw Solution Park ...
- Sketch Graphs Images
- Histograms Solution
- Data Flow Diagram For Website
- Histograms | How to Draw a Histogram in ConceptDraw PRO | Page ...
- Picture graphs - Vector stencils library | Total value of manufacturers ...
- How to Draw a Divided Bar Chart in ConceptDraw PRO | London ...