Basic Flowchart Symbols and Meaning


The vector stencils library "Meter indicators" contains 29 Live Objects: speedometer gauge, dial, bullet graph, slider and level meter visual indicators.
The Live Objects designed to display actual measures of performance metrics and KPIs from external data source files.
Some of them also display comparative measures, and colored zones of qualitative ranges with legend.
Use it to draw business performance dashboards using the ConceptDraw PRO diagramming and vector drawing software .
"Digital dashboards may be laid out to track the flows inherent in the business processes that they monitor. Graphically, users may see the high-level processes and then drill down into low level data. This level of detail is often buried deep within the corporate enterprise and otherwise unavailable to the senior executives. ...
Specialized dashboards may track all corporate functions. Examples include human resources, recruiting, sales, operations, security, information technology, project management, customer relationship management and many more departmental dashboards. ...
Like a car's dashboard (or control panel), a software dashboard provides decision makers with the input necessary to "drive" the business. Thus, a graphical user interface may be designed to display summaries, graphics (e.g., bar charts, pie charts, bullet graphs, "sparklines," etc.), and gauges (with colors similar to traffic lights) in a portal-like framework to highlight important information. ...
Digital dashboards allow managers to monitor the contribution of the various departments in their organization. To gauge exactly how well an organization is performing overall, digital dashboards allow you to capture and report specific data points from each department within the organization, thus providing a "snapshot" of performance." [Dashboard (management information systems). Wikipedia]
The example "Design elements - Meter indicators" is included in the Meter Dashboard solution from the area "What is a Dashboard" of ConceptDraw Solution Park.
Visual indicators

Competitor Analysis

Wireframe Tools

SWOT Template

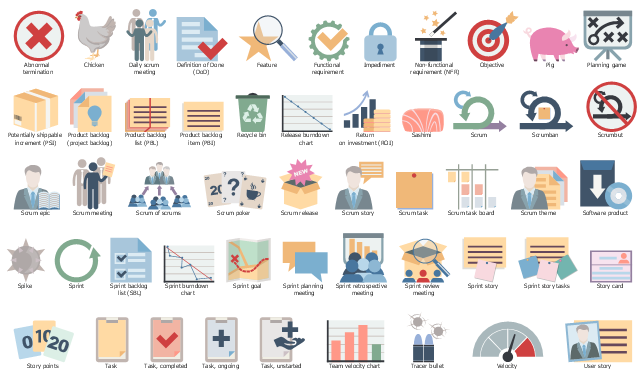
The vector stencils library "Scrum artifacts" contains 52 icons.
Use this clipart set to design your agile software development diagrams and infographics with ConceptDraw PRO software.
"Product backlog
The product backlog comprises an ordered list of requirements that a scrum team maintains for a product. It consists of features, bug fixes, non-functional requirements, etc.—whatever must be done to successfully deliver a viable product. The product owner orders the product backlog items (PBIs) based on considerations such as risk, business value, dependencies, and date needed. ...
Sprint backlog
The sprint backlog is the list of work the development team must address during the next sprint. The list is derived by the scrum team selecting product backlog items from the top of the product backlog until the development team feels it has enough work to fill the sprint. This is done by the development team asking "Can we also do this?" and adding product backlog items to the sprint backlog. The development team should keep in mind its past performance assessing its capacity for the new sprint, and use this as a guide line of how much "effort" they can complete.
The product backlog items may be broken down into tasks by the development team. Tasks on the sprint backlog are never assigned; rather, tasks are signed up for by the team members as needed according to the set priority and the development team member skills. This promotes self-organization of the development team, and developer buy-in. ...
Sprint burn-down chart
The sprint burndown chart is a public displayed chart showing remaining work in the sprint backlog. Updated every day, it gives a simple view of the sprint progress. ...
Release burn-down chart
The release burndown chart is the way for the team to track progress and provide visibility. The release burndown chart is updated at the end of each sprint by the scrum master. The horizontal axis of the release burndown chart shows the sprints; the vertical axis shows the amount of work remaining at the start of each sprint." [Scrum (software development). Wikipedia]
The clip art sample "Design elements - Scrum artifacts" is included in the Scrum solution from the Project Management area of ConceptDraw Solution Park.
Clipart set
- Typography Art | Typography Graphic | Typography Font | Typography
- Export from ConceptDraw PRO Document to a Graphic File ...
- Business Graphics Software | Customer Relationship Management ...
- Enterprise dashboard | KPI Dashboard | Business Graphics ...
- Types of summaries - Slide sample | Design elements - Sales KPIs ...
- Which Element Are Contained A Bullet
- KPI Dashboard | Business Graphics Software | Time Series ...
- Education | Design elements - Education titled callouts | How to ...
- Graphic Designer Kpi Examples
- Bullet Point Vector Png
- What is a Dashboard Area | Types of summaries - Slide sample ...
- Basic Flowchart Symbols and Meaning | UML Notation | Business ...
- Management indicators - Vector stencils library | Sales dashboard ...
- KPIs and Metrics | Sales metrics and KPIs - Visual dashboard | Meter ...
- Design elements - Glyph icons | Glyph icons - Vector stencils library ...
- Arrow Bullet Png
- Project management - Design Elements | Management - Design ...
- Design elements - Bulleted and numbered lists | Design elements ...
- Diamond Bullets
- Design elements - Meter indicators | Meter indicators 2 - Vector ...