Basic Flowchart Symbols and Meaning


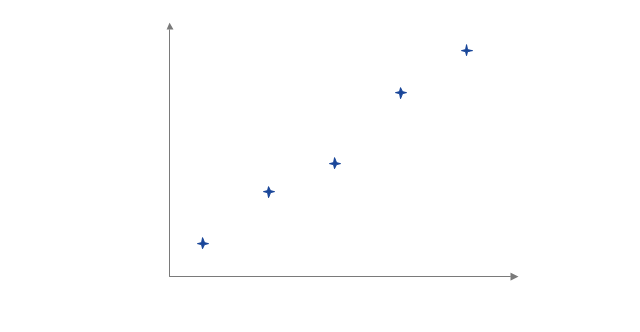
The vector stencils library "Correlation charts" contains 4 scatter plot templates.
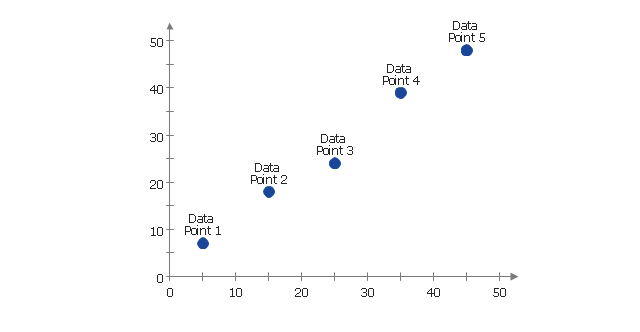
These scatterplots are Live Objects showing the relationship between two data sets from data source files.
User sets the data source file in Action menu of each scatter plot.
The scatter graphs example "Correlation charts - Vector stencils library" was created using the ConceptDraw PRO diagramming and vector drawing software extended with the Corellation Dashboard solution from the area "What is a Dashboard" of ConceptDraw Solution Park.
Scatter Plot 1
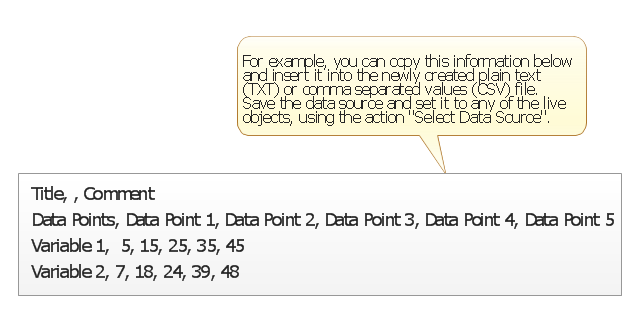
Data source file example
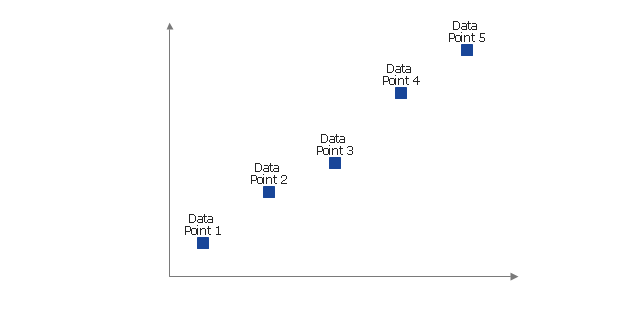
Scatter Plot 2
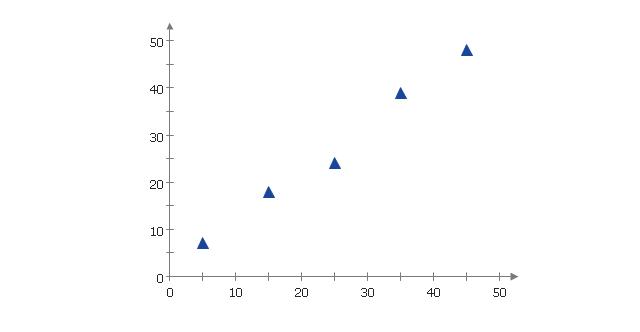
Scatter Plot 3
Scatter Plot 4
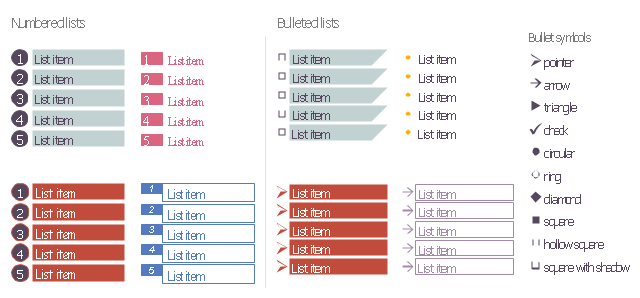
The vector stencils library "Education list blocks" contains 18 list block shapes: numbered list, bulleted list, bullets.
Use these list blocks to design your educational infograms.
"In typography, a bullet is a typographical symbol or glyph used to introduce items in a list. ...
The bullet symbol may take any of a variety of shapes, such as circular, square, diamond, arrow, etc. ...
Bullets are most often used in technical writing, reference works, notes and presentations. ...
Bulleted items – known as "bullet points" – may be short phrases, single sentences, or of paragraph length. Bulleted items are not usually terminated with a full stop if they are not complete sentences, although it is not rare to terminate every item except the last one with a semicolon, and terminate the last item with a full stop. It is correct to terminate a bullet point with a full stop if the text within that item consists of one 'full' sentence or more." [Bullet (typography). Wikipedia]
The shapes example "Design elements - Education list blocks" was created using the ConceptDraw PRO diagramming and vector drawing software extended with the Education Infographics solition from the area "Business Infographics" in ConceptDraw Solution Park.
Numbered lists, bulleted lists, bullets
ERD Symbols and Meanings


The vector stencils library "Meter indicators" contains 29 Live Objects: speedometer gauge, dial, bullet graph, slider and level meter visual indicators.
The Live Objects designed to display actual measures of performance metrics and KPIs from external data source files.
Some of them also display comparative measures, and colored zones of qualitative ranges with legend.
Use it to draw business performance dashboards using the ConceptDraw PRO diagramming and vector drawing software .
"Digital dashboards may be laid out to track the flows inherent in the business processes that they monitor. Graphically, users may see the high-level processes and then drill down into low level data. This level of detail is often buried deep within the corporate enterprise and otherwise unavailable to the senior executives. ...
Specialized dashboards may track all corporate functions. Examples include human resources, recruiting, sales, operations, security, information technology, project management, customer relationship management and many more departmental dashboards. ...
Like a car's dashboard (or control panel), a software dashboard provides decision makers with the input necessary to "drive" the business. Thus, a graphical user interface may be designed to display summaries, graphics (e.g., bar charts, pie charts, bullet graphs, "sparklines," etc.), and gauges (with colors similar to traffic lights) in a portal-like framework to highlight important information. ...
Digital dashboards allow managers to monitor the contribution of the various departments in their organization. To gauge exactly how well an organization is performing overall, digital dashboards allow you to capture and report specific data points from each department within the organization, thus providing a "snapshot" of performance." [Dashboard (management information systems). Wikipedia]
The example "Design elements - Meter indicators" is included in the Meter Dashboard solution from the area "What is a Dashboard" of ConceptDraw Solution Park.
Visual indicators

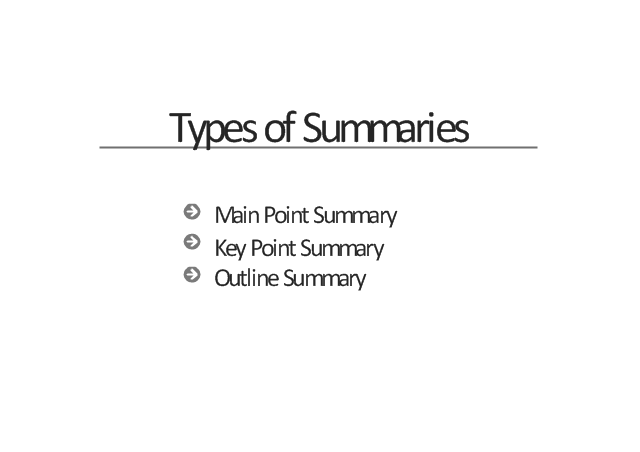
This presentation slide example contains a list of bullet points.
"In typography, a bullet is a typographical symbol or glyph used to introduce items in a list. ...
It is likely that the name originated from the resemblance of the traditional circular bullet symbol to an actual bullet.
The bullet symbol may take any of a variety of shapes, such as circular, square, diamond, arrow, etc., and typical word processor software offer a wide selection of shapes and colours. Several regular symbols are conventionally used in ASCII-only text or another environments where bullet characters are not available, such as * (asterisk), - (hyphen), . (period), and even o (lowercase O). Of course, when writing by hand, bullets may be drawn in any style. Historically, the index symbol was popular for similar uses." [Bullet (typography). Wikipedia]
The presentation slide example "Types of summaries" was created in the ConceptDraw PRO diagramming and vector drawing software using the Presentation Clipart solution from the Illustration area of ConceptDraw Solution Park.
Presentation slide
The vector stencils library "HR arrows" contains 57 arrow pictograms.
Use this arrow icon set to draw your HR flowcharts, workflow diagrams and process charts with the ConceptDraw PRO diagramming and vector drawing software.
The arrow icons library "HR arrows" is included in the HR Flowcharts solution from the Management area of ConceptDraw Solution Park.
Use this arrow icon set to draw your HR flowcharts, workflow diagrams and process charts with the ConceptDraw PRO diagramming and vector drawing software.
The arrow icons library "HR arrows" is included in the HR Flowcharts solution from the Management area of ConceptDraw Solution Park.
Arki arrow
Chevron arrow
Triangle arrow
Small arrow
Up arrow
Down arrow
Right arrow
Left arrow
Vertical moving arrow
Wavy arrow
Fat arrow
Straight arrow
Angle arrow
Double headed arrow
Single headed arrow
Elbow arrow
Crossed arrows
Turn left arrow
Turn right arrow
L-shaped arrow
Corner arrow
Diagonal arrow
Split arrow
Arc arrow
Bent arrow
Go back arrow
Double headed semicircle arrow
Counterclockwise arrow
Sector arrow
Clockwise arrow
Arrow fork
Merging arrows
U-shaped arrow
Semicircle arrow
Circular arrow
Looping arrows
Refresh arrows
Double arc arrow
Curving directional arrow
S-shaped arrow
Short arc arrow
Long arc arrow
Turn round arrow
Rotating arrows
Turned arrow
Curved left arrow
Curved right arrow
Cycle arrow
Arrow loop
Moving down arrow
Moving up arrow
Dual short arc arrow
Recycling arrows
Interaction arrows
Lightning arrow
Ribbon arrow
Circular motion arrows
The vector stencils library "Maintenance" contains 14 symbols for maintaining electrical and electronic systems, including test, feedback and reference signals; pulses; relay contacts and coils; and composite and amplifier circuits.
Use these shapes for drawing electronic diagrams in the ConceptDraw PRO diagramming and vector drawing software extended with the Electrical Engineering solution from the Engineering area of ConceptDraw Solution Park.
www.conceptdraw.com/ solution-park/ engineering-electrical
Use these shapes for drawing electronic diagrams in the ConceptDraw PRO diagramming and vector drawing software extended with the Electrical Engineering solution from the Engineering area of ConceptDraw Solution Park.
www.conceptdraw.com/ solution-park/ engineering-electrical
Signal generator

Linear element

Relay contacts

Relay coil
Switch
Composite circuit
Amplifier
Signal code, normal

Signal code, secondary flow

Reference signal

Energize relay signal

Transmitter pulse

Test signal

Feedback

UML Class Diagram


Electrical Symbols — Terminals and Connectors
