Project management - Design Elements

Management - Design Elements

Aircraft - Design Elements

Advertising - Design Elements

The vector stencils library "Management pictograms" contains 72 ideograms. Use this flat icon set to design your management infograms.
"An ideogram or ideograph is a graphic symbol that represents an idea or concept, independent of any particular language, and specific words or phrases. Some ideograms are comprehensible only by familiarity with prior convention; others convey their meaning through pictorial resemblance to a physical object, and thus may also be referred to as pictograms." [Ideogram. Wikipedia]
The ideogram example "Design elements - Management pictograms" was created using the ConceptDraw PRO diagramming and vector drawing software extended with the Management Infographics solition from the area "Business Infographics" in ConceptDraw Solution Park.
Management pictograms

The vector stencils library "Management" contains 20 management icons.
Use it to design your business and finance illustrations and infographics with ConceptDraw PRO diagramming and vector drawing software.
"Management in businesses and other organizations, including not-for-profit organizations and government bodies, refers to the individuals who set the strategy of the organization and coordinate the efforts of employees (or volunteers, in the case of some voluntary organizations) to accomplish objectives by using available human, financial and other resources efficiently and effectively. Resourcing encompasses the deployment and manipulation of human resources, financial resources, technological resources, natural resources and other resources." [Management. Wikipedia]
The icon set example "Design elements - Management" is included in the Business and Finance solution from Illustration area of ConceptDraw Solution Park.
Icon set
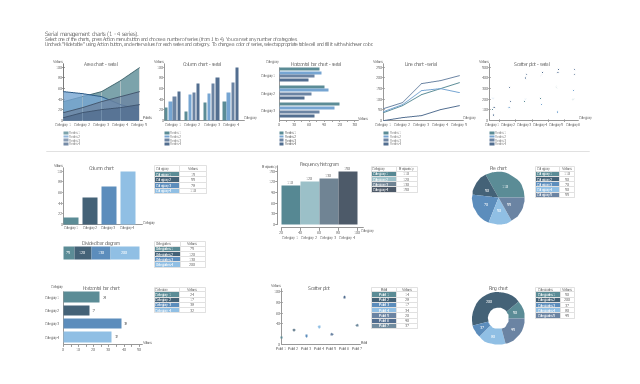
The vector stencils library "Management charts" contains 12 graphs and charts: area chart, column chart, divided bar diagram, histogram, horizontal bar graph, line graph, pie chart, ring chart, scatter plot.
Use it to create your management infograms.
"A chart can take a large variety of forms, however there are common features that provide the chart with its ability to extract meaning from data.
Typically the data in a chart is represented graphically, since humans are generally able to infer meaning from pictures quicker than from text. Text is generally used only to annotate the data.
One of the more important uses of text in a graph is the title. A graph's title usually appears above the main graphic and provides a succinct description of what the data in the graph refers to.
Dimensions in the data are often displayed on axes. If a horizontal and a vertical axis are used, they are usually referred to as the x-axis and y-axis respectively. Each axis will have a scale, denoted by periodic graduations and usually accompanied by numerical or categorical indications. Each axis will typically also have a label displayed outside or beside it, briefly describing the dimension represented. If the scale is numerical, the label will often be suffixed with the unit of that scale in parentheses. ...
The data of a chart can appear in all manner of formats, and may include individual textual labels describing the datum associated with the indicated position in the chart. The data may appear as dots or shapes, connected or unconnected, and in any combination of colors and patterns. Inferences or points of interest can be overlaid directly on the graph to further aid information extraction.
When the data appearing in a chart contains multiple variables, the chart may include a legend (also known as a key). A legend contains a list of the variables appearing in the chart and an example of their appearance. This information allows the data from each variable to be identified in the chart." [Chart. Wikipedia]
The shapes example "Design elements - Management charts" was created using the ConceptDraw PRO diagramming and vector drawing software extended with the Management Infographics solition from the area "Business Infographics" in ConceptDraw Solution Park.
Graphs and charts
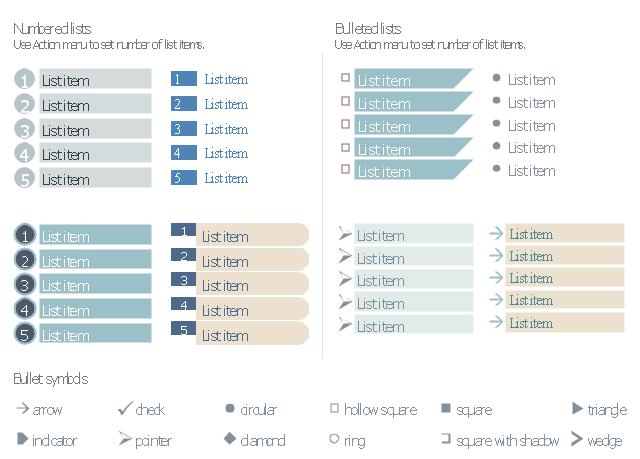
The vector stencils library "Management list blocks" contains 20 list block shapes: numbered list, bulleted list, bullets.
Use these list elements to design your management infograms.
"In typography, a bullet is a typographical symbol or glyph used to introduce items in a list. ...
The bullet symbol may take any of a variety of shapes, such as circular, square, diamond, arrow, etc. ...
Bullets are most often used in technical writing, reference works, notes and presentations. ...
Bulleted items – known as "bullet points" – may be short phrases, single sentences, or of paragraph length. Bulleted items are not usually terminated with a full stop if they are not complete sentences, although it is not rare to terminate every item except the last one with a semicolon, and terminate the last item with a full stop. It is correct to terminate a bullet point with a full stop if the text within that item consists of one 'full' sentence or more." [Bullet (typography). Wikipedia]
The shapes example "Design elements - Management list blocks" was created using the ConceptDraw PRO diagramming and vector drawing software extended with the Management Infographics solition from the area "Business Infographics" in ConceptDraw Solution Park.
Numbered lists, bulleted lists, bullets
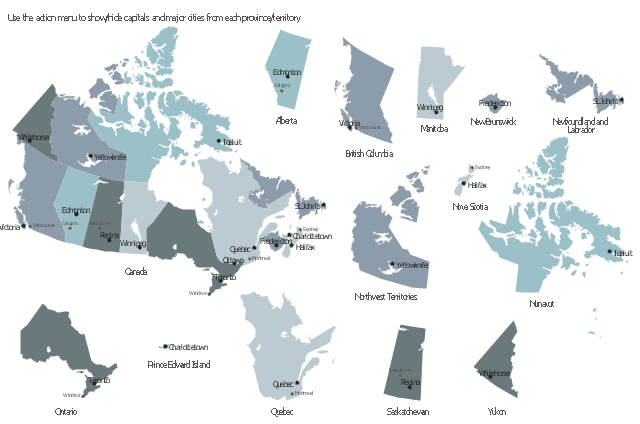
This sample displays state map contours with capitals and major cities of Canada provinces and territories. Use it to design your management infographics.
"The provinces and territories of Canada combine to make up the world's second-largest country by area. ... The ten provinces are Alberta, British Columbia, Manitoba, New Brunswick, Newfoundland and Labrador, Nova Scotia, Ontario, Prince Edward Island, Quebec, and Saskatchewan. The three territories are Northwest Territories, Nunavut, and Yukon." [Canada. Wikipedia]
The infogram shapes example "Design elements - Management map Canada" was created using the ConceptDraw PRO diagramming and vector drawing software extended with the Management Infographics solition from the area "Business Infographics" in ConceptDraw Solution Park.
Canada state map contours
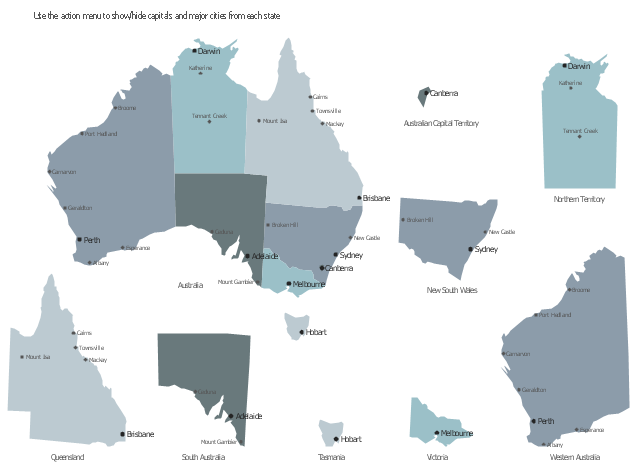
This sample displays map contours with capitals and main cities of Australia . Use it design your management infographics.
"The states and mainland territories of the Commonwealth of Australia combine to make up the world's sixth-largest country by total area. Australia comprises six states and various territories; the Australian mainland is made up of five states and three territories (including small, somewhat anomalous Jervis Bay Territory), with the sixth state being located on the island of Tasmania to the south of the mainland. In addition, there are six island territories, known as external territories. Australia also claims part of Antarctica as the Australian Antarctic Territory." [States and territories of Australia. Wikipedia]
The infogram shapes example "Design elements - Management map Australia" was created using the ConceptDraw PRO diagramming and vector drawing software extended with the Management Infographics solition from the area "Business Infographics" in ConceptDraw Solution Park.
Australia state map contours
The vector stencils library "Project management" contains 30 project management icons.
Use it to design your business and finance illustrations and infographics with ConceptDraw PRO diagramming and vector drawing software.
"Project management is the discipline of initiating, planning, executing, controlling, and closing the work of a team to achieve specific goals and meet specific success criteria. A project is a temporary endeavor designed to produce a unique product, service or result with a defined beginning and end (usually time-constrained, and often constrained by funding or deliverables) undertaken to meet unique goals and objectives, typically to bring about beneficial change or added value." [Project management. Wikipedia]
The icon set example "Design elements - Project management" is included in the Business and Finance solution from Illustration area of ConceptDraw Solution Park.
Icon set
The vector stencils library "Management maps" contains 44 state map contours with capitals and major cities: G-20 state maps, EU state maps and world map.
Use it to visualize geospatial information in your education infograms.
"The European Union (EU) is a politico-economic union of 28 member states that are primarily located in Europe: Austria, Belgium, Bulgaria, Croatia, Cyprus, Czech Republic, Denmark, Estonia, Finland, France, Germany, Greece, Hungary, Ireland, Italy, Latvia, Lithuania, Luxembourg, Malta, Netherlands, Poland, Portugal, Romania, Slovakia, Slovenia, Spain, Sweden, United Kingdom." [European Union. Wikipedia]
The European Union map contours example "Design elements - Management maps (EU)" was created using the ConceptDraw PRO diagramming and vector drawing software extended with the Management Infographics solition from the area "Business Infographics" in ConceptDraw Solution Park.
European Union state map contours
.png--diagram-flowchart-example.png)
The vector stencils library "AWS Deployment and Management" contains 26 Amazon Web Services deployment and management icons: AWS Elastic Beanstalk, AWS CloudFormation, AWS CodeDeploy, AWS OpsWorks, AWS Identify and Access Management.
Use it to draw Amazon Web Services architecture diagrams.
The AWS icons example "Design elements - AWS Deployment and Management" was created using the ConceptDraw PRO diagramming and vector drawing software extended with the AWS Architecture Diagrams solution from the Computer and Networks area of ConceptDraw Solution Park.
AWS architecture diagram icons
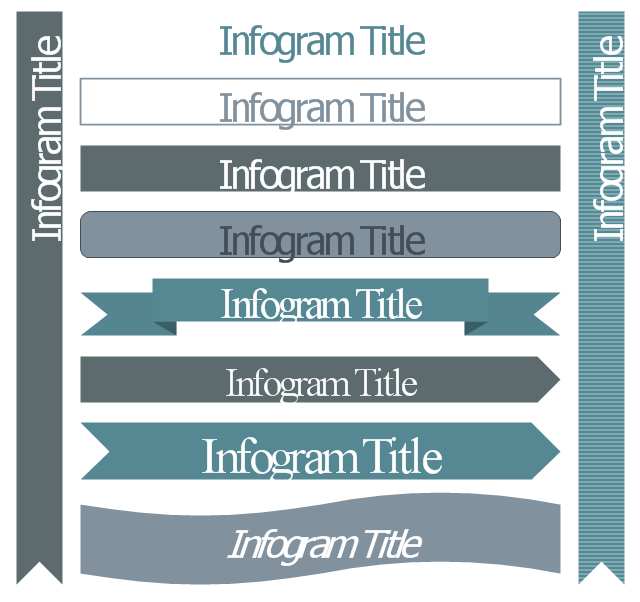
The vector stencils library "Management title blocks" contains 10 shapes: rectangle, rounded rectangle, ribbon, arrow, flag, bookmark.
Use it to design your management infogram.
The titles example "Design elements - Management title blocks" was created using the ConceptDraw PRO diagramming and vector drawing software extended with the Management Infographics solition from the area "Business Infographics" in ConceptDraw Solution Park.
Infographic titles
- Design elements - Management | Management - Design Elements ...
- Project management - Design Elements | | | Clipart Project ...
- Management - Design Elements | Project management - Design ...
- Advertising - Design Elements | Project management - Design ...
- Aircraft - Design Elements | Project management - Design Elements ...
- Project management - Design Elements | Business and Finance ...
- ConceptDraw PROJECT Project Management Tool | Project ...
- Accounting Flowchart | Management - Design Elements | Flowchart ...
- Management - Design Elements | Graphs and Charts Area ...
- Design elements - Fire safety equipment | Marketing - Design ...
- PM Response | PM Dashboards | Project management - Design ...
- Diagram For Business Strategy Project Management
- Project management - Design Elements | Structured Systems ...
- Project management - Design Elements | Remote Projects in ...
- Project management - Design Elements | Design elements - Project ...
- Money - Design Elements | Currency - Design Elements | Design ...
- Project management - Design Elements | Project management ...
- PM Docs | Project management - Design Elements | Design ...
- Pareto Chart | Seven Basic Tools of Quality - Pareto Chart | Design ...
- Design elements - TQM diagram | TQM diagram example | Total ...