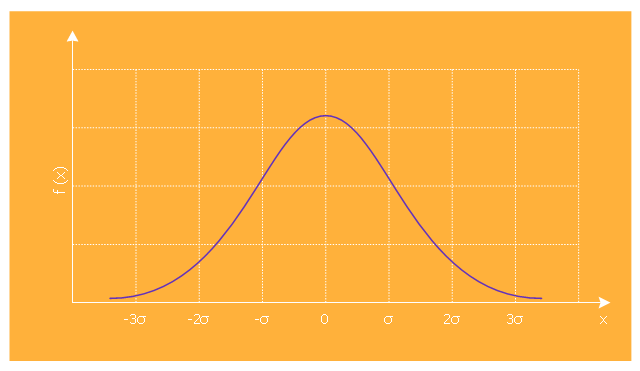
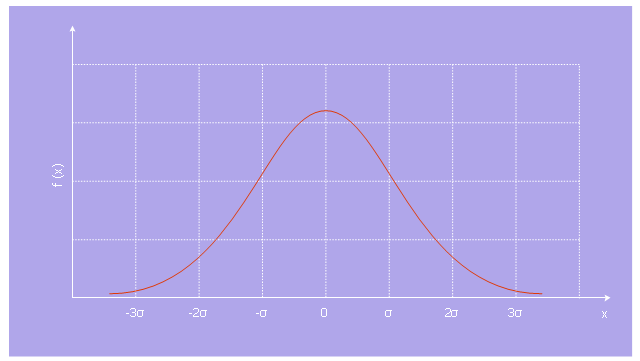
Normal (or Gaussian) distribution (bell curve) graph visualize a continuous probability distribution that is often used as a first approximation to describe real-valued random variables that tend to cluster around a single mean value.
The template "Normal distribution graph" for the ConceptDraw PRO diagramming and vector drawing software is included in the Marketing Diagrams solution from the Marketing area of ConceptDraw Solution Park.
www.conceptdraw.com/ solution-park/ marketing-diagrams
The template "Normal distribution graph" for the ConceptDraw PRO diagramming and vector drawing software is included in the Marketing Diagrams solution from the Marketing area of ConceptDraw Solution Park.
www.conceptdraw.com/ solution-park/ marketing-diagrams
Normal distribution graph template
 Marketing Diagrams
This solution extends ConceptDraw PRO with samples, templates and library of design elements for drawing the marketing diagrams.
The vector stencils library "Marketing diagrams" contains 9 templates of marketing and sales diagrams and charts.
Use these shapes to illustrate your marketing and sales documents, presentations, infographics and webpages in the ConceptDraw PRO diagramming and vector drawing software extended with the Marketing Diagrams solution from the Marketing area of ConceptDraw Solution Park.
www.conceptdraw.com/ solution-park/ marketing-diagrams
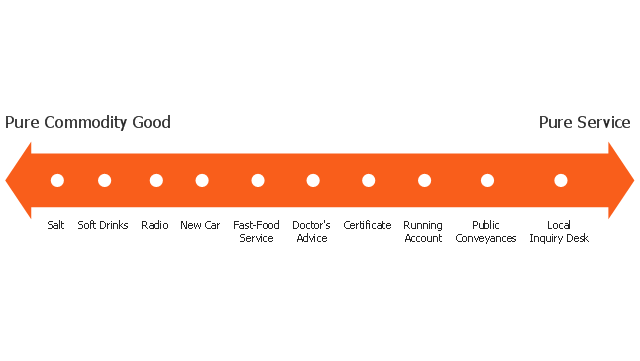
Service-goods continuum diagram
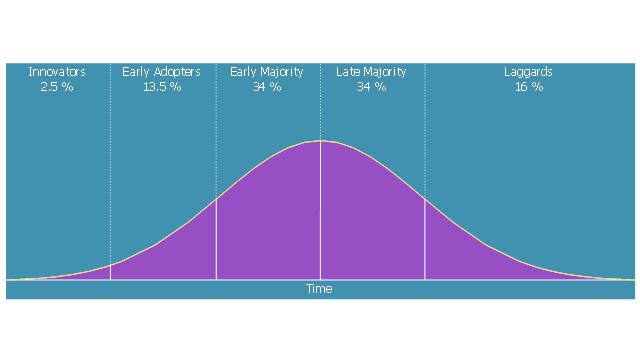
Diffusion of Innovations
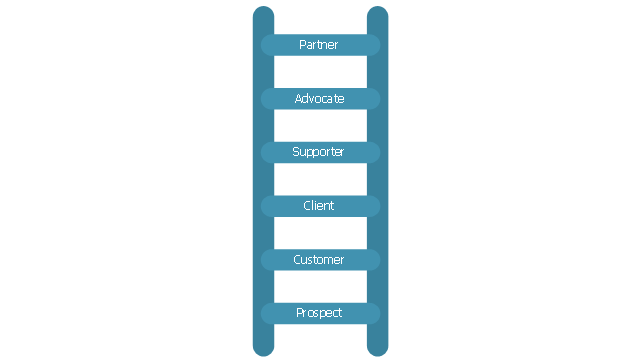
Relationship ladder of customer loyalty
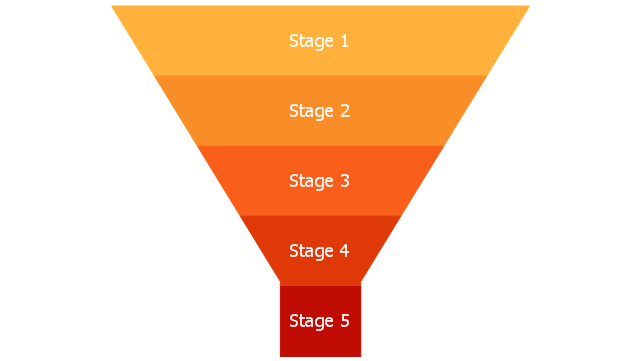
Leaky bucket diagram

Normal distribution
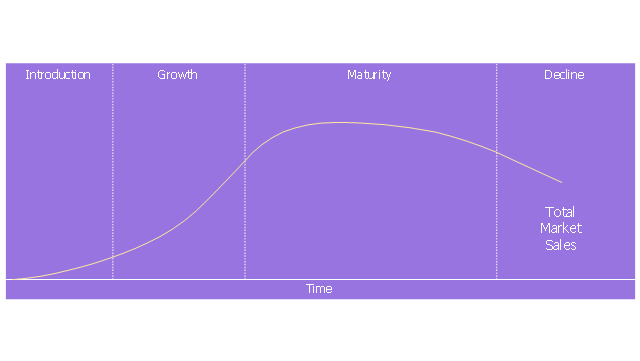
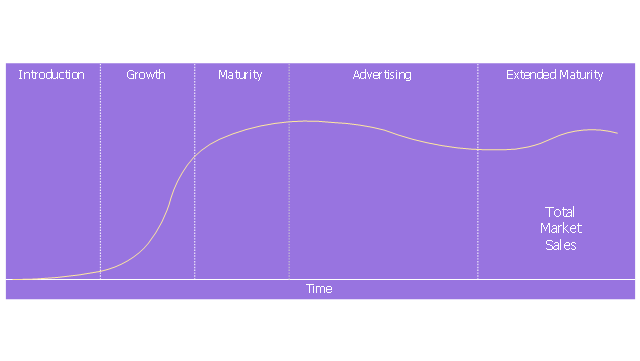
Product life cycle graph
Extended product life cycle graph
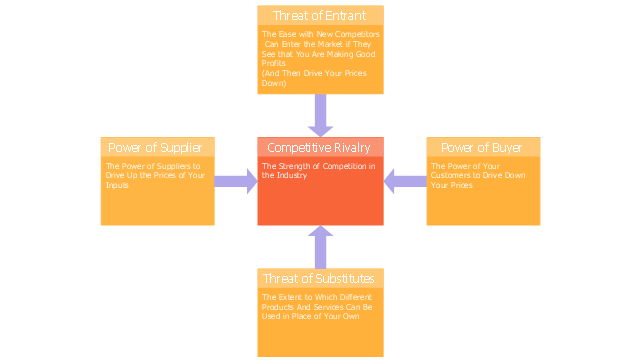
Five forces model
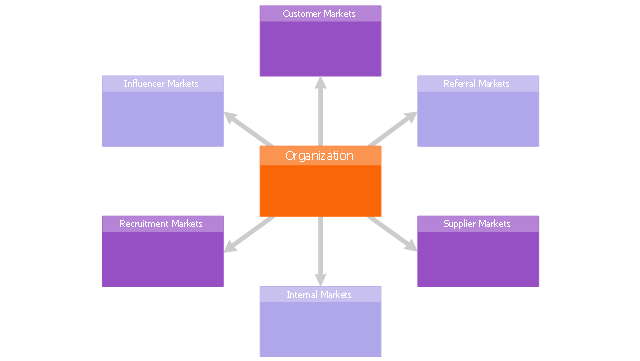
Six markets model
Step chart block
Step diagram block

 Histograms
How to make a Histogram? Making a Histogram is an incredibly easy process when it is done with ConceptDraw PRO. The Histograms Solution enhances ConceptDraw PRO v10 functionality with extensive drawing tools, numerous samples, and examples; also a quick-start template and library of ready vector stencils for visualization the data and professional drawing Histograms.
 USA Maps
Use the USA Maps solution to create a map of USA, a US interstate map, printable US maps, US maps with cities and US maps with capitals. Create a complete USA states map.
 Business Process Model and Notation
Business Process Model and Notation Solution for ConceptDraw PRO is helpful for modeling the business processes of any degree of complexity, documenting them and effective creating diagrams using the BPMN 2.0 standard.
 Status Dashboard
Status dashboard solution extends ConceptDraw PRO software with templates, samples and vector stencils libraries with graphic indicators for drawing the visual dashboards showing status data.
- Normal distribution graph - Template | Picture Graphs | Competitor ...
- Histogram - Template | Normal distribution graph - Template ...
- Normal distribution graph - Template | Histogram example - Age of ...
- Normal distribution graph - Template | Marketing diagrams - Vector ...
- Normal ( Gaussian ) distribution graph | Normal distribution graph ...
- Normal distribution graph - Template | Bell Curve Graph Template
- Normal distribution | Interior Design Storage and Distribution ...
- UML Diagram | Basic Flowchart Symbols and Meaning | Normal ...
- Line Chart Template for Word | Scatter graph - Template | Scatter ...