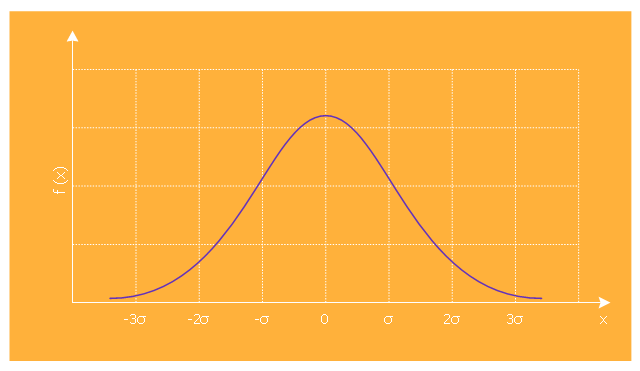
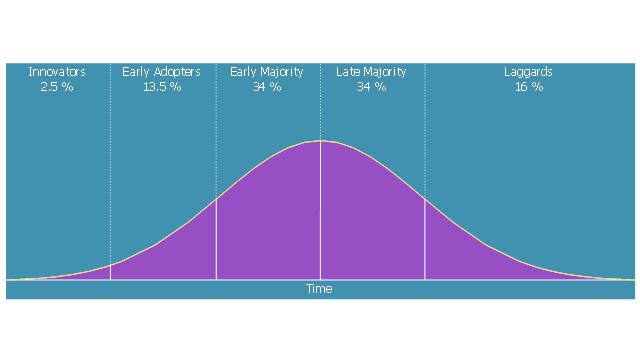
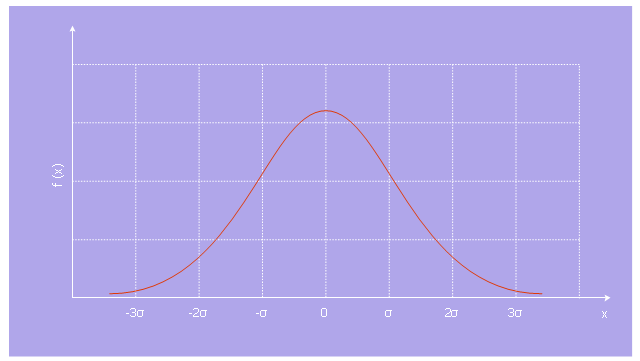
Normal (or Gaussian) distribution (bell curve) graph visualize a continuous probability distribution that is often used as a first approximation to describe real-valued random variables that tend to cluster around a single mean value.
The template "Normal distribution graph" for the ConceptDraw PRO diagramming and vector drawing software is included in the Marketing Diagrams solution from the Marketing area of ConceptDraw Solution Park.
www.conceptdraw.com/ solution-park/ marketing-diagrams
The template "Normal distribution graph" for the ConceptDraw PRO diagramming and vector drawing software is included in the Marketing Diagrams solution from the Marketing area of ConceptDraw Solution Park.
www.conceptdraw.com/ solution-park/ marketing-diagrams
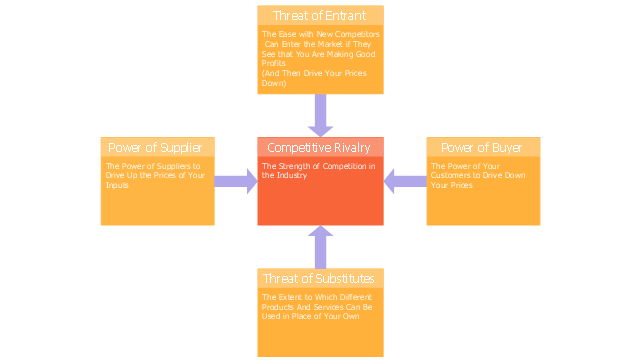
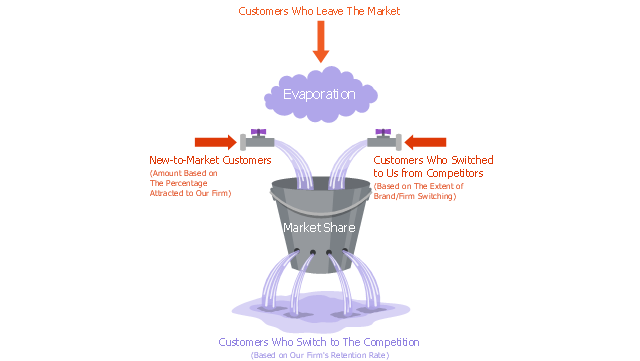
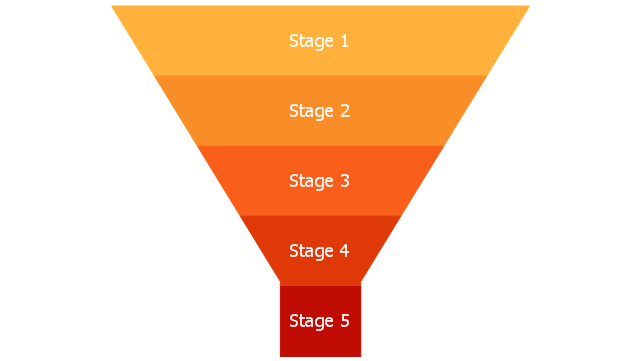
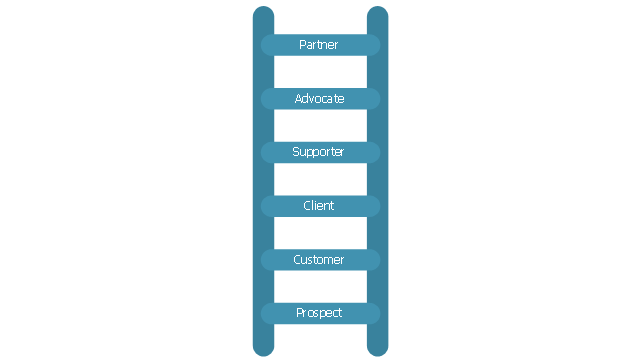
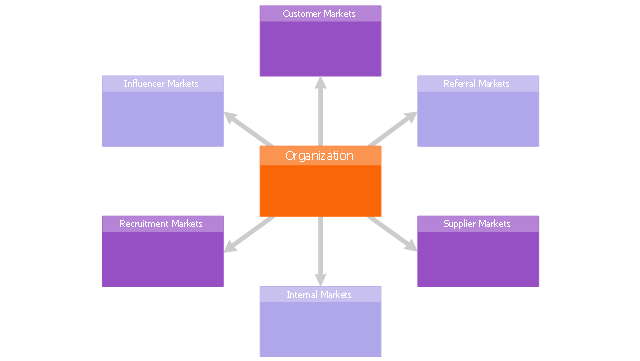
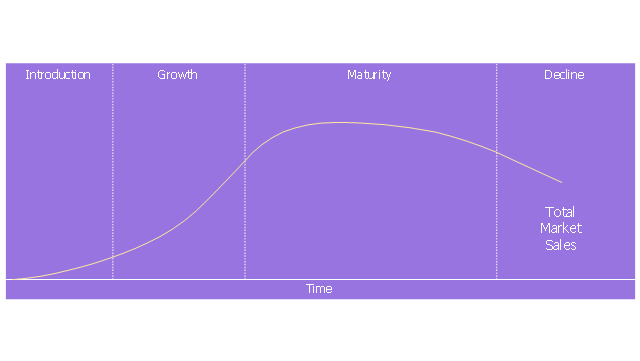
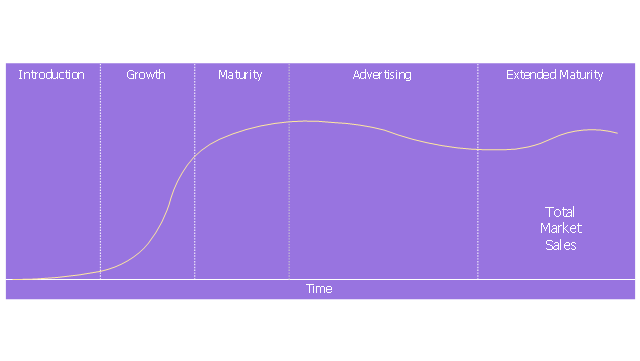
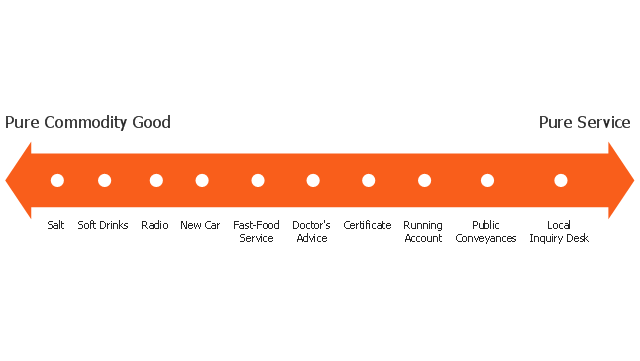
The vector stencils library "Marketing diagrams" contains 9 templates of marketing and sales diagrams and charts.
Use these shapes to illustrate your marketing and sales documents, presentations, infographics and webpages in the ConceptDraw PRO diagramming and vector drawing software extended with the Marketing Diagrams solution from the Marketing area of ConceptDraw Solution Park.
www.conceptdraw.com/ solution-park/ marketing-diagrams
 Histograms
How to make a Histogram? Making a Histogram is an incredibly easy process when it is done with ConceptDraw PRO. The Histograms Solution enhances ConceptDraw PRO v10 functionality with extensive drawing tools, numerous samples, and examples; also a quick-start template and library of ready vector stencils for visualization the data and professional drawing Histograms.
 Marketing Diagrams
This solution extends ConceptDraw PRO with samples, templates and library of design elements for drawing the marketing diagrams.
 USA Maps
Use the USA Maps solution to create a map of USA, a US interstate map, printable US maps, US maps with cities and US maps with capitals. Create a complete USA states map.
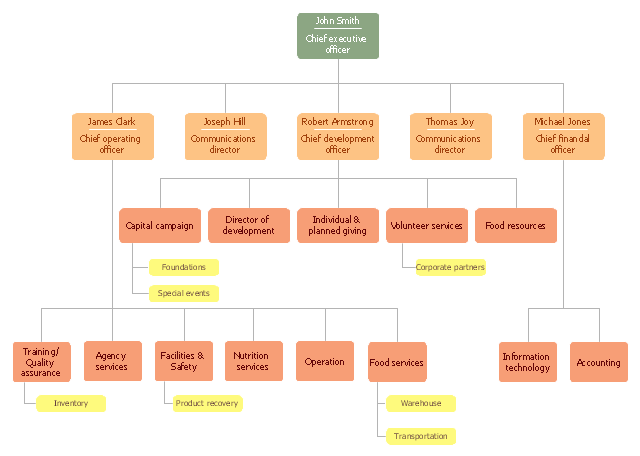
"A food bank or foodbank is a non-profit, charitable organization that distributes food to those who have difficulty purchasing enough food to avoid hunger.
In the United States and Australia, food banks usually operate on the "warehouse" model. They act as food storage and distribution depots for smaller front line agencies; and usually do not themselves give out food directly to the hungry. After the food is collected, sorted, and reviewed for quality, these food banks distribute it to non-profit community or government agencies, including food pantries, food closets, soup kitchens, homeless shelters, orphanages, and schools.
Outside North America and Australia, the "front line" model is often found. Such food banks give out most or all of their food directly to the end users. For both models, the largest sources of food include for-profit growers, manufacturers, distributors and retailers who in the normal course of business have excess food that they cannot sell. Some foodbanks receive a substantial proportion of their food from individual donors, including their volunteer workers. There is considerable overlap with food salvage, food rescue and gleaning, although not with freeganism or dumpster-diving." [Food bank. Wikipedia]
The organization chart example "Foodbank" was created using the ConceptDraw PRO diagramming and vector drawing software extended with the Organizational Charts solution from the Management area of ConceptDraw Solution Park.
 Business Process Model and Notation
Business Process Model and Notation Solution for ConceptDraw PRO is helpful for modeling the business processes of any degree of complexity, documenting them and effective creating diagrams using the BPMN 2.0 standard.
 Status Dashboard
Status dashboard solution extends ConceptDraw PRO software with templates, samples and vector stencils libraries with graphic indicators for drawing the visual dashboards showing status data.
 Project Management Area
Project Management area provides Toolbox solutions to support solving issues related to planning, tracking, milestones, events, resource usage, and other typical project management functions.
- Normal distribution | Interior Design Storage and Distribution ...
- Histogram - Template | Normal distribution graph - Template ...
- Normal distribution graph - Template | Competitor Analysis ...
- Normal distribution graph - Template | Marketing Diagrams ...
- Normal ( Gaussian ) distribution graph | Normal distribution graph ...
- Normal distribution graph - Template | Bell Curve Graph Template
- Normal distribution graph - Template | Histogram example - Age of ...
- Normal Distribution Dashboard Dials
- Flow Chart For Normal Distribution
- Cisco IBM. Cisco icons, shapes, stencils and symbols | UML ...
- Diagram Of Sales And Distribution Model
- Normal distribution
- A process with normal flow | Marketing diagrams - Vector stencils ...
- Interior Design Storage and Distribution - Design Elements ...
- Normal Product Cycle Block Diagram
- Interior Design Storage and Distribution - Design Elements ...
- Line Chart Template for Word | Scatter graph - Template | Double ...
- Diffusion of innovations graph | Marketing Diagrams | Marketing ...
- Frequency Distribution Dashboard | Flow chart Example ...
