The vector stencils library "Line graphs" contains 5 templates of line graphs and scatter charts for visualizing data changes over time. Drag a template from the library to your document and enter your data.
Use these shapes to draw your line and scatter charts in the ConceptDraw PRO diagramming and vector drawing software.
The vector stencils library "Line graphs" is included in the Line Graphs solution from the Graphs and Charts area of ConceptDraw Solution Park.
Use these shapes to draw your line and scatter charts in the ConceptDraw PRO diagramming and vector drawing software.
The vector stencils library "Line graphs" is included in the Line Graphs solution from the Graphs and Charts area of ConceptDraw Solution Park.
Line graph (text -> height)
-line-graphs---vector-stencils-library.png--diagram-flowchart-example.png)
Line graph (control dots)
-line-graphs---vector-stencils-library.png--diagram-flowchart-example.png)
Scatter chart (text -> height)
-line-graphs---vector-stencils-library.png--diagram-flowchart-example.png)
Scatter chart (control dots)
-line-graphs---vector-stencils-library.png--diagram-flowchart-example.png)
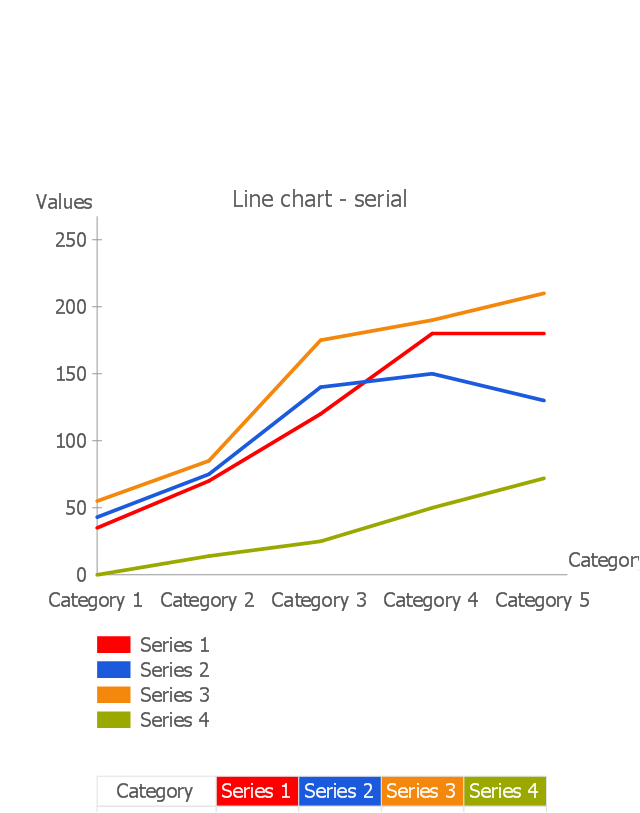
Line chart - serial
Line Graph

How to Draw a Line Graph

Line Graph Charting Software

The vector stencils library "Data-driven charts" contains 13 data-driven graphs and charts: area chart, divided bar diagram, double bar graph, frequency histogram, horizontal bar chart, line graph, percentage ring chart, percentage pie chart, scatter plot, column chart, waterfall chart.
Use it to visualize quantitative data in your data-driven infographics.
The graphs example "Data-driven charts - Vector stencils library" was created using the ConceptDraw PRO diagramming and vector graphics software extended with the Data-driven Infographics solution from the area "What is infographics" of ConceptDraw Solution Park.
Area chart

Divided bar diagram

Double bar graph

Frequency histogram

Horizontal bar graph

Line graph

Percentage ring chart

Pie chart

Percentage pie chart

Ring chart

Scatter plot

Column chart (vertical bar graph)
-data-driven-charts---vector-stencils-library.png--diagram-flowchart-example.png)
Waterfall chart

Line Chart Template for Word

What Is a Line Chart

Pictures of Graphs

Scatter Graph

The vector stencils library "Education charts" contains 12 graphs and charts: area chart, column chart, divided bar diagram, histogram, horizontal bar graph, line graph, pie chart, ring chart, scatter plot.
Use it to create your education infogram in the ConceptDraw PRO diagramming and vector drawing software.
The vector stencils library "Education charts" is included in the Education Infographics solution from the Business Infographics area of ConceptDraw Solution Park.
Use it to create your education infogram in the ConceptDraw PRO diagramming and vector drawing software.
The vector stencils library "Education charts" is included in the Education Infographics solution from the Business Infographics area of ConceptDraw Solution Park.
Area chart - serial

Column chart

Column chart - serial

Divided bar diagram

Frequency histogram

Horizontal bar chart

Horizontal bar chart - serial

Line chart - serial

Pie chart

Ring chart

Scatter plot

Scatter plot - serial

Line Chart Examples

Scatter Graph Charting Software

The vector stencils library "Data-driven charts" contains 13 data-driven graphs and charts: area chart, divided bar diagram, double bar graph, frequency histogram, horizontal bar chart, line graph, percentage ring chart, percentage pie chart, scatter plot, column chart, waterfall chart.
Use it to visualize quantitative data in your data-driven infographics.
The graphs example "Data-driven charts - Vector stencils library" was created using the ConceptDraw PRO diagramming and vector graphics software extended with the Data-driven Infographics solution from the area "What is infographics" of ConceptDraw Solution Park.
Use it to visualize quantitative data in your data-driven infographics.
The graphs example "Data-driven charts - Vector stencils library" was created using the ConceptDraw PRO diagramming and vector graphics software extended with the Data-driven Infographics solution from the area "What is infographics" of ConceptDraw Solution Park.
Area chart
Divided bar diagram
Double bar graph
Frequency histogram
Horizontal bar graph
Line graph
Percentage ring chart
Pie chart
Percentage pie chart
Ring chart
Scatter plot
Column chart (vertical bar graph)
Waterfall chart
Polar Graph

Basic Diagramming


- Line graphs - Vector stencils library | Data-driven charts - Vector ...
- Education charts - Vector stencils library | Line Graph | Line Chart ...
- Scatter graphs - Vector stencils library | Line graphs - Vector stencils ...
- Line Graph
- Time series charts - Vector stencils library | Line Chart Examples ...
- Line graphs - Vector stencils library | Transmission paths - Vector ...
- Line graphs - Vector stencils library
- Basic Line Graphs | GHS Hazard Pictograms | Arrows - Vector clipart ...
- Line graphs - Vector stencils library | How to Draw a Line Graph ...
- Picture graphs - Vector stencils library | Line graphs - Vector stencils ...
- Line graphs - Vector stencils library | Line Graph | How to Draw a ...
- Basic Diagramming | Step Area Graph | Area Chart | The Drawing Of ...
- Scatter graphs - Vector stencils library | Picture graphs - Vector ...
- Line Graph
- Picture Graph | Line Chart Examples | Project Timeline | Population ...
- Professions - Vector stencils library | Line graphs - Vector stencils ...
- Bar Graphs | Data-driven charts - Vector stencils library | Chart ...
- Line Chart Examples | Line Chart Templates | Line Chart | Time ...
- Time Series Dashboard | Time series charts - Vector stencils library ...
- Education On A Line Graph