Chart Examples
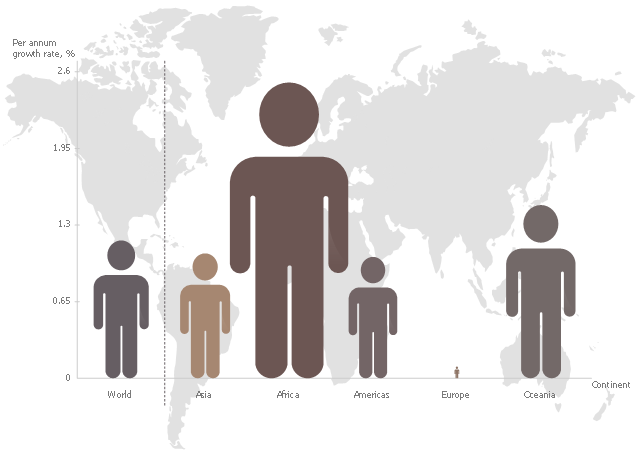
Easy charting software comes with beautiful chart templates and examples. This makes it easy to create professional charts without prior experience.This pictorial chart sample shows the population growth by continent in 2010-2013.
"Population growth' refers to the growth in human populations. Global population growth is around 80 million annually, or 1.2% p.a. The global population has grown from 1 billion in 1800 to 7 billion in 2012. It is expected to keep growing to reach 11 billion by the end of the century. Most of the growth occurs in the nations with the most poverty, showing the direct link between high population growth and low standards of living. The nations with high standards of living generally have low or zero rates of population growth. Australia's population growth is around 400,000 annually, or 1.8% p.a., which is nearly double the global average. It is caused mainly by very high immigration of around 200,000 p.a., the highest immigration rate in the world. Australia remains the only nation in the world with both high population growth and high standards of living." [Population growth. Wikipedia]
The image chart example "Population growth by continent, 2010 - 2013" was created using the ConceptDraw PRO diagramming and vector drawing software extended with the Basic Picture Graphs solution from the Graphs and Charts area of ConceptDraw Solution Park.
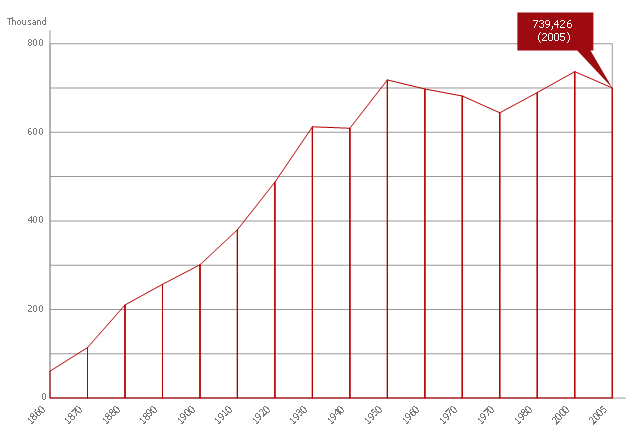
This area chart sample shows the population growth of San Francisco, California from 1850-2005. It was redesigned from the Wikimedia Commons file: San Francisco CA Population Growth.svg. [commons.wikimedia.org/ wiki/ File:San_ Francisco_ CA_ Population_ Growth.svg]
"The San Francisco Bay Area, commonly known as the Bay Area, is a populated region that surrounds the San Francisco and San Pablo estuaries in Northern California, United States. The region encompasses the major cities and metropolitan areas of San Francisco, Oakland, and San Jose, along with smaller urban and rural areas. The Bay Area's nine counties are Alameda, Contra Costa, Marin, Napa, San Francisco, San Mateo, Santa Clara, Solano, and Sonoma. Home to approximately 7.44 million people, the nine-county Bay Area contains many cities, towns, airports, and associated regional, state, and national parks, connected by a network of roads, highways, railroads, bridges, tunnels and commuter rail. The combined urban area of San Francisco and San Jose is the second largest in California (after the Greater Los Angeles area), the fifth largest in the United States, and the 56th largest urban area in the world." [San Francisco Bay Area. Wikipedia]
The area graph example "San Francisco CA Population Growth" was created using the ConceptDraw PRO diagramming and vector drawing software extended with the Area Charts solution from the Graphs and Charts area of ConceptDraw Solution Park.
 Picture Graphs
Typically, a Picture Graph has very broad usage. They many times used successfully in marketing, management, and manufacturing. The Picture Graphs Solution extends the capabilities of ConceptDraw PRO v10 with templates, samples, and a library of professionally developed vector stencils for designing Picture Graphs.
Line Graph Charting Software
To design line and scatter charts use ConceptDraw PRO diagramming and vector drawing software extended with Line Graphs solution from Graphs and Charts area of ConceptDraw PRO Solution Park. (Line chart, scatter chart, 2d chart).Geo Map — Asia
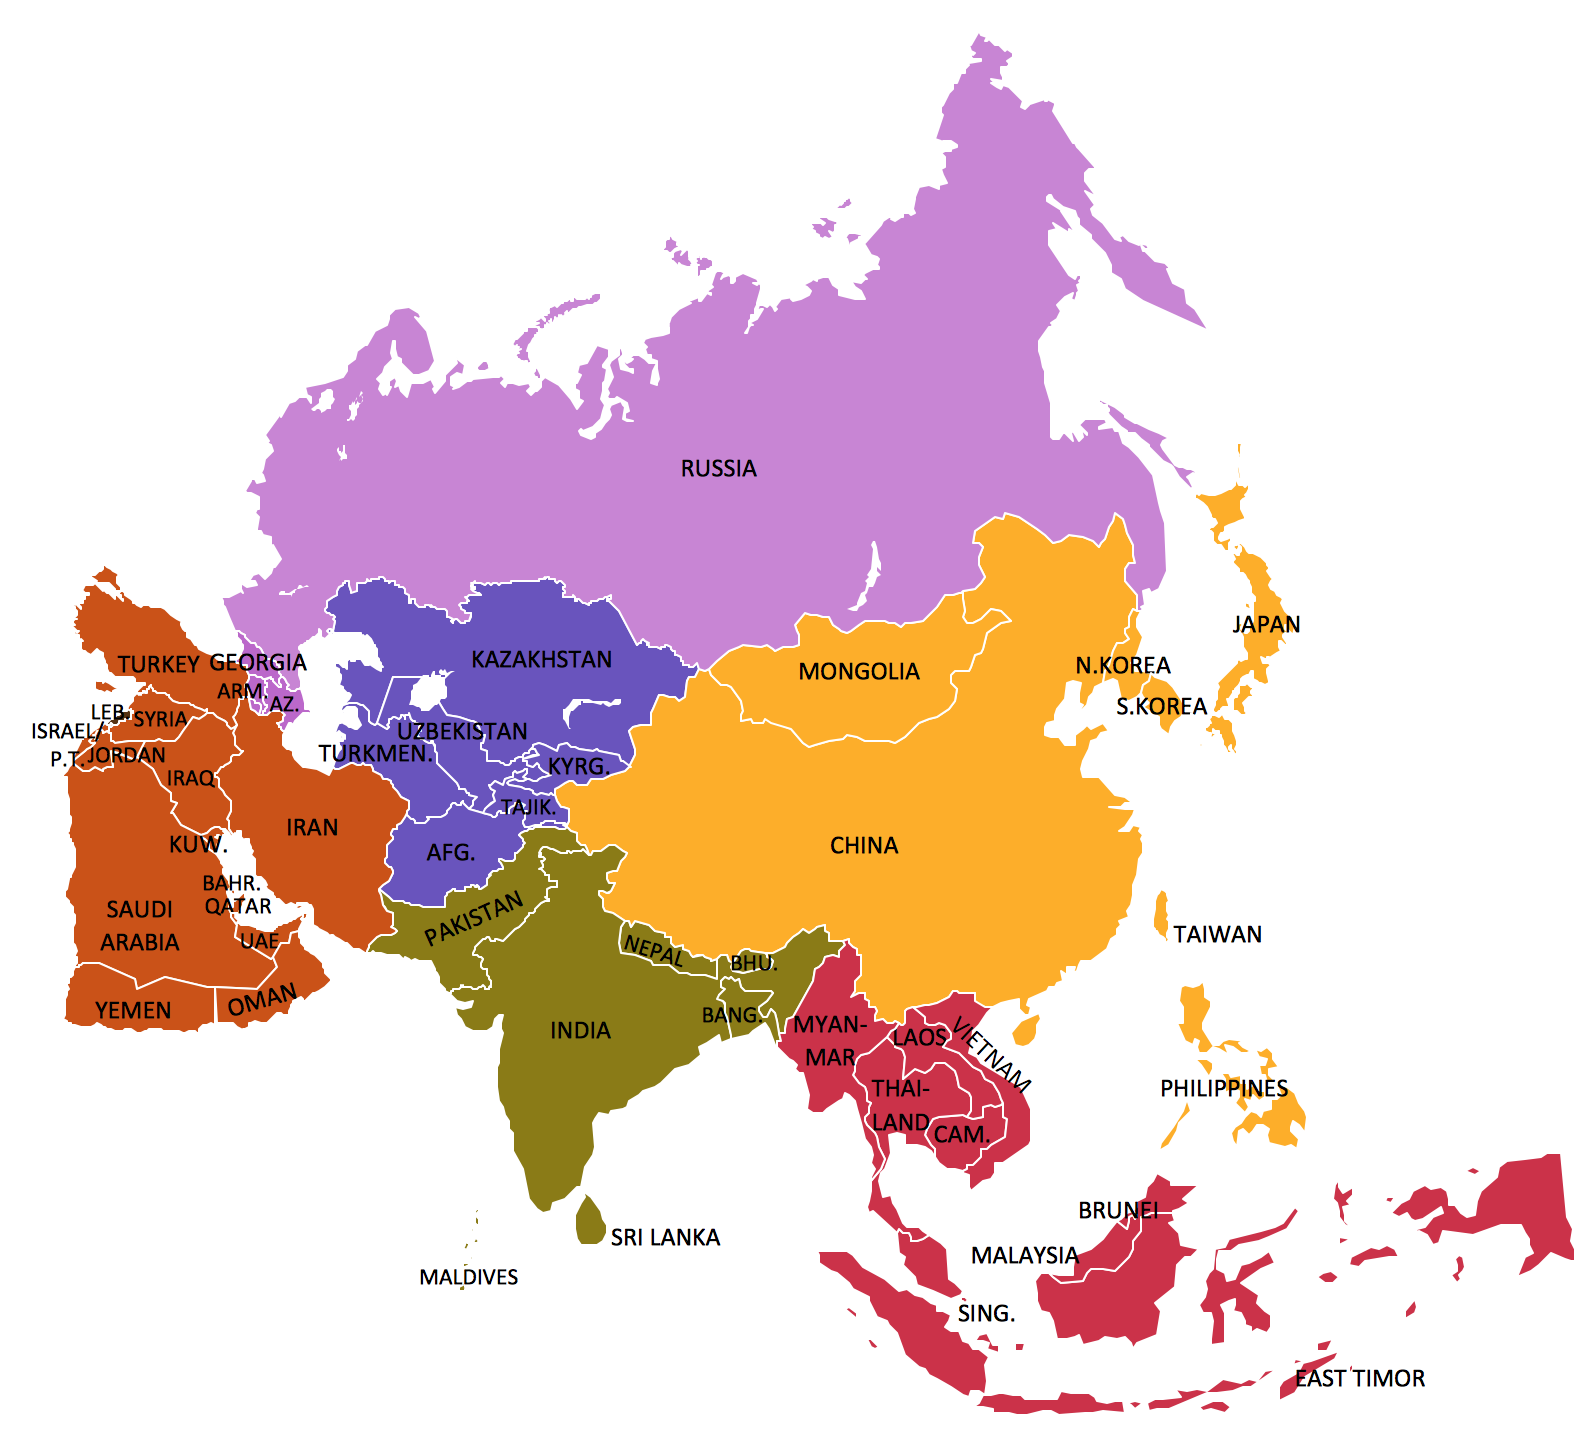
ConceptDraw is idea to draw the geological maps of Asia from the pre-designed vector geo map shapes. Use Geo Map Asia to draw thematic maps, geospatial infographics and vector illustrations for your business documents, presentations and websites.Competitor Analysis
Competitor analysis is a first and obligatory step in elaboration the proper corporate marketing strategy and creating sustainable competitive advantage. Use powerful opportunities of numerous solutions from ConceptDraw Solution Park for designing illustrative diagrams, charts, matrices which are necessary for effective competitor analysis.
 Food Court
Use the Food Court solution to create food art. Pictures of food can be designed using libraries of food images, fruit art and pictures of vegetables.
 Marketing Diagrams
Marketing Diagrams solution extends ConceptDraw PRO diagramming software with abundance of samples, templates and vector design elements intended for easy graphical visualization and drawing different types of Marketing diagrams and graphs, including Branding Strategies Diagram, Five Forces Model Diagram, Decision Tree Diagram, Puzzle Diagram, Step Diagram, Process Chart, Strategy Map, Funnel Diagram, Value Chain Diagram, Ladder of Customer Loyalty Diagram, Leaky Bucket Diagram, Promotional Mix Diagram, Service-Goods Continuum Diagram, Six Markets Model Diagram, Sources of Customer Satisfaction Diagram, etc. Analyze effectively the marketing activity of your company and apply the optimal marketing methods with ConceptDraw PRO software.
How To use House Electrical Plan Software
How we can conduct the electricity at house correctly without a plan? It is impossible. The House electrical diagram depicts locations of switches, outlets, dimmers and lights, and lets understand how you will connect them. But design of House Electrical Plan looks a complex task at a glance, which requires a lot of tools and special experience. But now all is simple with all-inclusive floor plan software - ConceptDraw PRO. As a house electrical plan software, the ConceptDraw PRO contains libraries with a large range of professional lighting and electrical symbols, ready-to-use electrical plans samples and examples, and built-in templates for creating great-looking Home floor electrical plans. It is a fastest way to draw Electrical circuit diagrams, Electrical wiring and Circuit schematics, Digital circuits, Electrical equipment, House electrical plans, Satellite television, Cable television, Home cinema, Closed-circuit television when are used the tools of Electric and Telecom Plans Solution from ConceptDraw Solution Park. Files created in Visio for Mac app can be easily imported to ConceptDraw PRO. Also you may import stencils and even libraries. Try for free an alternative to Visio that Apple users recommend.
Positioning Map
ConceptDraw PRO is a powerful diagramming and vector drawing software. Extended with Matrices Solution from the Marketing Area of ConceptDraw Solution Park it became the best software for quick and easy designing various types of Matrix Diagrams, including Positioning Map.Swot Analysis Examples for Mac OSX
SWOT is an acronym of the words Strengts, Weaknesses, Opportunities and Тhreats. SWOT analysis is used to show the real situation and prospects of the company on the market, the internal environment of the company is reflected by S and W, and external by O and T. SWOT analysis is a quality tool for structuring available information, which is successfully used in the process of strategy planning, it helps analysts in formulation recommendations on the basis of collected information and data, structured in a form of SWOT Matrix. The SWOT analysis is effective and simple in use, however its results in great depend on the completeness and quality of initial information, from the depth of understanding of the current state and development trends of the market, and also from the used software. ConceptDraw PRO extended with powerful tools of SWOT and TOWS Matrix Diagrams solution, containing templates and SWOT analysis examples for Mac OSX and Windows, is ideal software for creation professional SWOT Matrices and SWOT Analysis Matrices.SWOT Matrix Template
SWOT analysis is a structured planning method, which lets define the objective of the business, internal and external factors favorable or unfavorable for achieving this objective, represent Strengths, Weaknesses, Opportunities, and Threats on the SWOT Matrix. SWOT analysis can be conducted for an industry, company, product, place, or person. It lets to choose the best path for development of an organization, helps to avoid dangers, gives opportunity to establish relationship between the potential of an organization and the problems, lets to assess the values of profitability and compare them with performance of competitors, gives the possibility to expand and enhance the competitive advantages. SWOT and TOWS Matrix Diagrams solution included to ConceptDraw Solution Park contains wide variety of SWOT and TOWS matrix diagrams examples and samples, and also specially developed templates. Each SWOT template have great value in easy and quick drawing of SWOT matrices and diagrams in ConceptDraw PRO diagramming and vector drawing software for Mac OSX and Windows.- Bar Graph Of Population Growth Rate
- Chart Examples | Geo Map - Asia | Picture Graphs | Growth Rate ...
- Line Graph Growth Rate Examples
- Population Growth Rate Images Chart
- Bar Graphs | Sales Growth . Bar Graphs Example | Bar Chart ...
- Bar Graphs | Sales Growth . Bar Graphs Example | Bar Graph | Bar ...
- Line Graph Showing The Annual Growth Rate Of Population
- Barrie population - Picture bar graph | Regional population growth ...
- Population Growth Line Graph
- Serious crime in Cincinnati | Bar Graphs | Chart Examples | Crime ...
- Pictures of Graphs | Chart Maker for Presentations | Basic ...
- Bar Graphs | Picture Graphs | Sales Growth . Bar Graphs Example ...
- Regional population growth from 2010 to 2016 | Picture Graph ...
- Basic Diagramming | Line Graph | Pictures of Graphs | Line Chart ...
- Sales Growth . Bar Graphs Example | Sales Dashboards for Your ...
- Picture Graphs | Regional population growth from 2010 to 2016 ...
- Regional population growth from 2010 to 2016 | Pictures of Graphs ...
- Basic Diagramming | Line Graphs | Picture Graph | Line Chart ...
- Basic Diagramming | Pictures of Graphs | Chart Maker for ...
- What Is a Line Chart | Picture Graph | Basic Diagramming ...


