Infographic Generator

Spatial infographics Design Elements: Continental Map

Design Element: Crows Foot for Entity Relationship Diagram - ERD
")
Entity Relationship Diagram - ERD - Software for Design Crows Foot ER Diagrams
_Win_Mac.png "Entity Relationship Diagram Software, Design Elements - Crows Foot (Windows, Macintosh)")

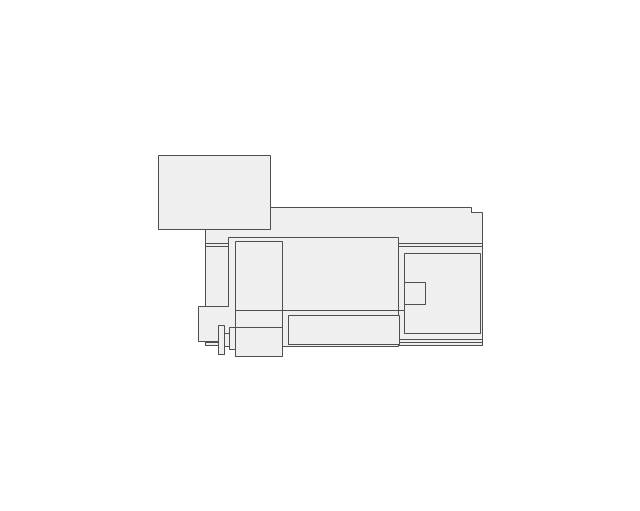
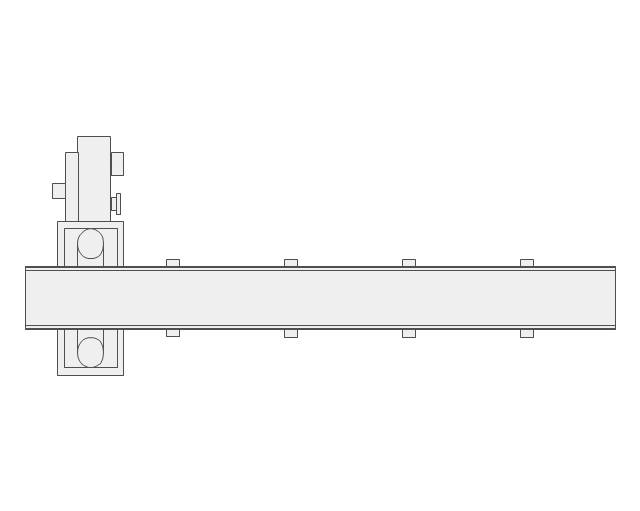
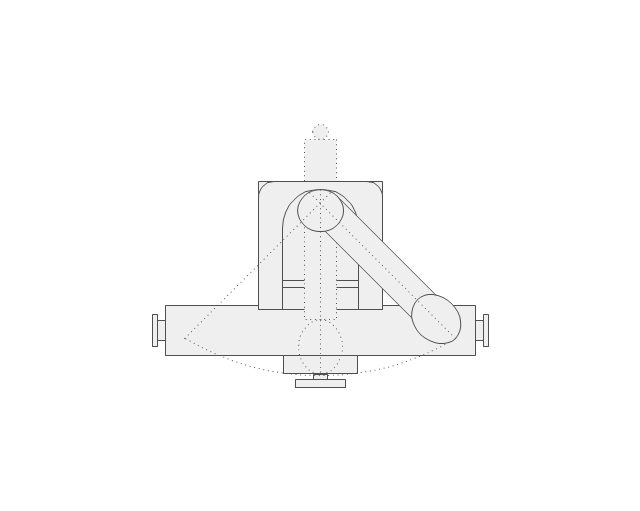
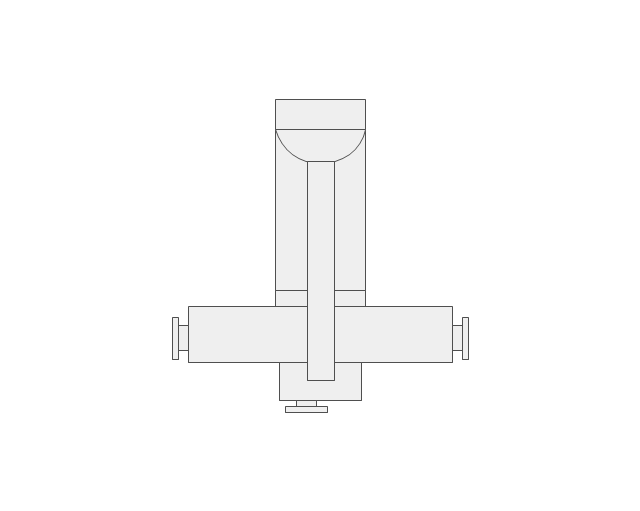
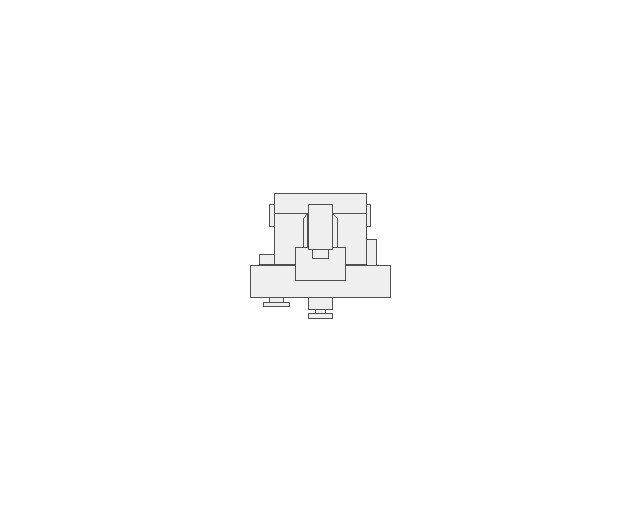
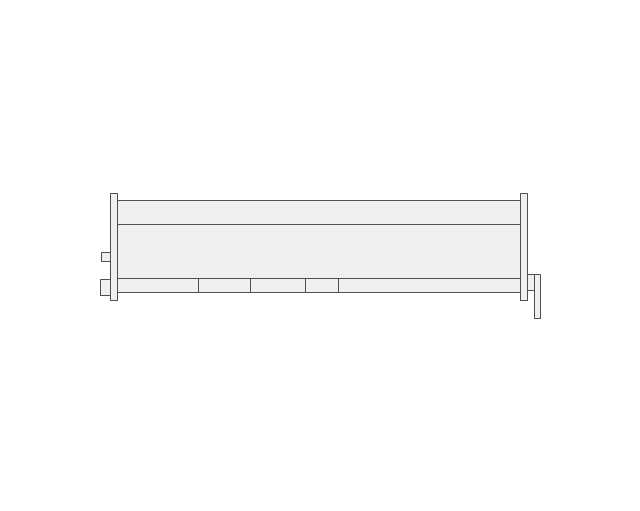
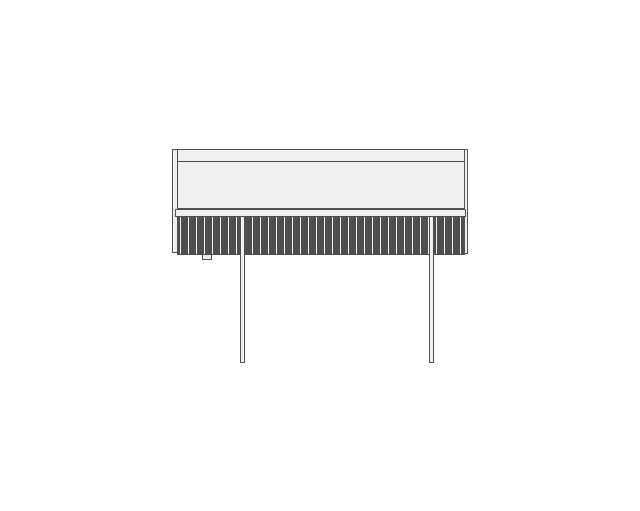
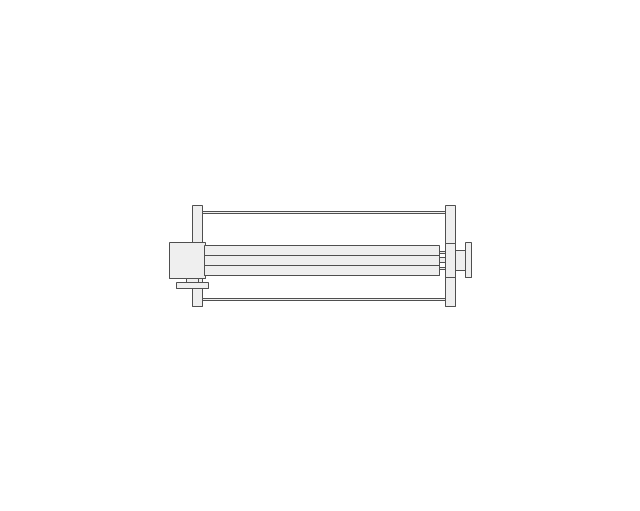
The vector stencils library "Machines and equipment" contains 24 shapes of industrial machines and equipment.
Use it for drawing plant floor plans and manufacturing warehouse layouts the ConceptDraw PRO diagramming and vector drawing software extended with the Plant Layout Plans solution from the Building Plans area of ConceptDraw Solution Park.
www.conceptdraw.com/ solution-park/ building-plant-layout-plans
Computer numerical control lathe
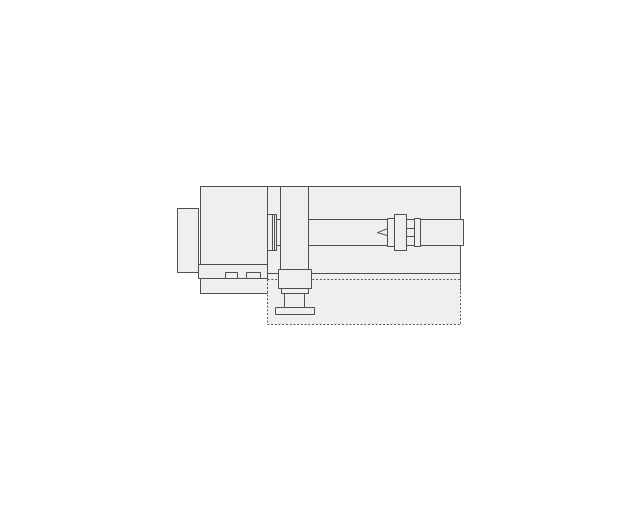
Centre lathe
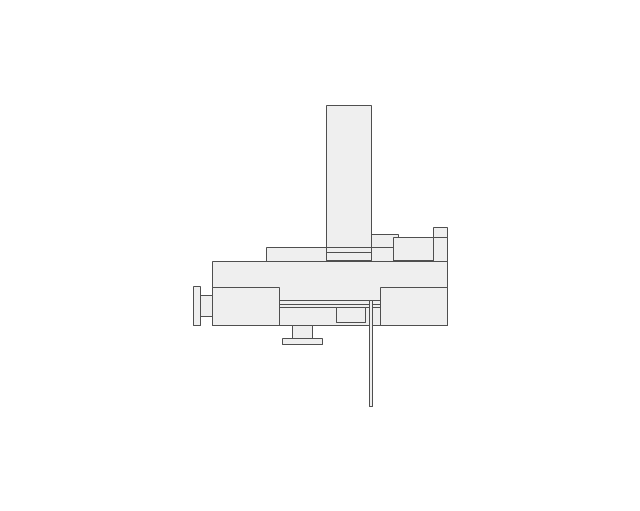
Horizontal band saw
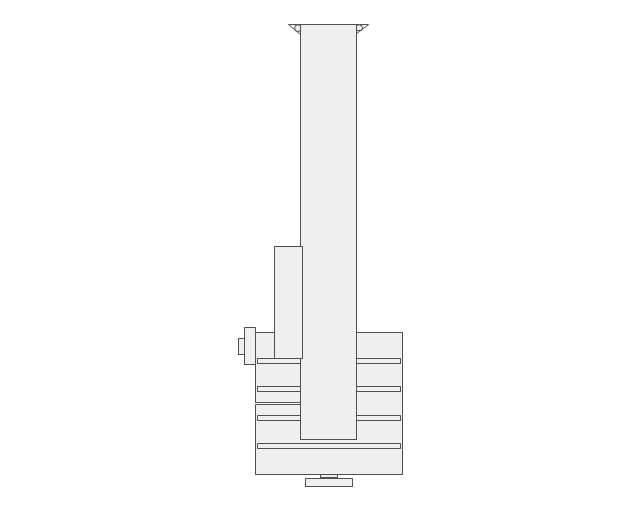
Vertical band saw
Sawing machine
Turret milling machine
Vertical milling machine

Horizontal milling machine
Surface grinder
Shaping machine

Folding machine
Shearing machine
Hand roller press
Drill press

Drilling machine

Tungsten inert gas welding

Metal inert gas welding

Generator

Compressor

Platform trolley

Mobile tool box

Fire extinguisher

First aid cabinet

Operator

Process Flowchart


HelpDesk
How to Create a Typography Infographic Using ConceptDraw PRO

Windows Azure

Donut Chart Templates

Simple & Fast Diagram Software


Map Infographic Creator

How to Create a Social Media DFD Flowchart

Polar Graph

Activity on Node Network Diagramming Tool

- Infographic Generator | Management Tools | Infographic Examples ...
- Infographic Generator | Rotating equipment - Vector stencils lybrary ...
- Maintenance - Vector stencils library | Manufacturing and ...
- Map Infographic Maker | Best Tool for Infographic Construction ...
- Wireframe Tools | Wireframe Examples | Wireframing | Wireframe ...
- Sentence Diagramming Generator
- Infographic Generator | How to Create a Typography Infographic ...
- Infographic Generator | Basic Diagramming | Map Infographic ...
- Business Productivity Diagramming | Business Productivity ...
- Uml Generator
- Use the Best FlowChart Tool for the Job | Flowchart Software ...
- Online Diagram Tool | UML Component Diagram Example - Online ...
- Vector Map of Germany | Manufacturing and Maintenance | Energy ...
- Infographic Generator | How to Create a Timeline Diagram in ...
- Tools - Vector stencils library
- Machines and equipment - Vector stencils library | Machines and ...
- Block Diagram Generator Online
- Flowchart Generator Online
- Algorithm Flowchart Generator
- Activity on Node Network Diagramming Tool | Program Evaluation ...