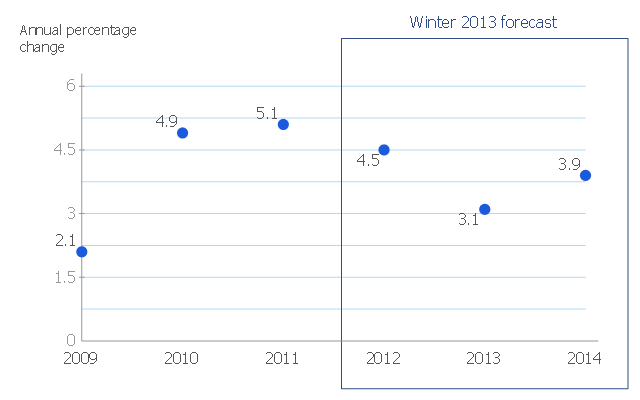
This scatter chart sample shows the MENA's (Middle East and North Africa's) real GDP growth. It was designed on the base scatter graph from the website of the European Economic Forecast (EUROPEAN ECONOMY 1|2013, Economic and Financial Affairs Winter 2013, European Commission). [ec.europa.eu/ economy_ finance/ publications/ european_ economy/ 2013/ pdf/ ee1_ en.pdf]
"The term MENA, for "Middle East and North Africa", is an acronym often used in academic, military planning, disaster relief, and business writing.
Due to the geographic ambiguity and Eurocentric nature of the term "Middle East", many people prefer use of the term WANA (West Asia and North Africa) or the less common NAWA (North Africa-West Asia).
The term covers an extensive region, extending from Morocco to Iran, including the majority of both the Middle Eastern and Maghreb countries. The term is roughly synonymous with the term the Greater Middle East. ...
MENA has no standardized definition; different organizations define the region as consisting of different territories. The following is a list of commonly included countries and territories: Bahrain, Egypt, Iran, Iraq, Israel, Jordan, Kuwait, Lebanon, Yemen, United Arab Emirates, Libya, Morocco, Oman, West Bank and Gaza, Qatar, Saudi Arabia, Syria, Tunisia, Algeria.
Sometimes also included in broader definitions: Armenia, Azerbaijan, Cyprus, Djibouti, Mauritania, Somalia, Sudan, Turkey, Western Sahara." [MENA. Wikipedia]
The scatter chart example "Middle East and North Africa's real GDP growth" was created using the ConceptDraw PRO diagramming and vector drawing software extended with the Line Graphs solution from the Graphs and Charts area of ConceptDraw Solution Park.
Scatter graph
Geo Map - USA - Massachusetts

Geo Map — Asia — Indonesia

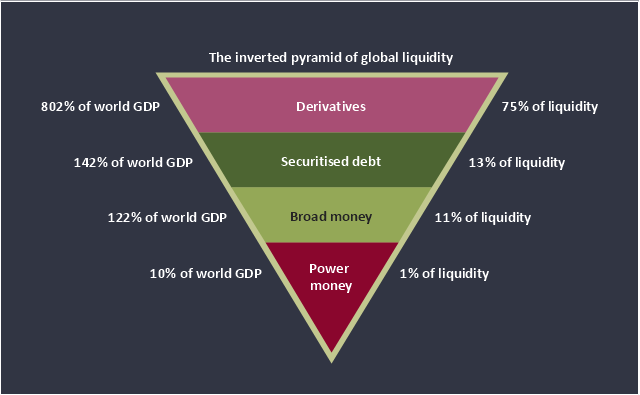
This inverted pyramid diagram of global liquidity shows world GDP and liquidity for 4 levels: derivatives, securitised debt, broad money, and power money.
"In business, economics or investment, market liquidity is a market's ability to facilitate an asset being sold quickly without having to reduce its price very much (or even at all). Equivalently, an asset's market liquidity (or simply "an asset's liquidity") is the asset's ability to sell quickly without having to reduce its price very much. Liquidity is about how big the trade-off is between the speed of the sale and the price it can be sold for. In a liquid market, the trade-off is mild: selling quickly will not reduce the price much. In a relatively illiquid market, selling it quickly will require cutting its price by some amount.
Money, or cash, is the most liquid asset, because it can be "sold" for goods and services instantly with no loss of value. There is no wait for a suitable buyer of the cash. There is no trade-off between speed and value. It can be used immediately to perform economic actions like buying, selling, or paying debt, meeting immediate wants and needs.
If an asset is moderately (or very) liquid, it has moderate (or high) liquidity. In an alternative definition, liquidity can mean the amount of highly liquid assets. If a business has moderate liquidity, it has a moderate amount of very liquid assets. If a business has sufficient liquidity, it has a sufficient amount of very liquid assets and the ability to meet its payment obligations." [Market liquidity. Wikipedia]
This inverted triangle diagram was redesigned using the ConceptDraw PRO diagramming and vector drawing software from Wikimedia Commons file The inverted pyramid of global liquidity.gif. [commons.wikimedia.org/ wiki/ File:The_ inverted_ pyramid_ of_ global_ liquidity.gif]
This triangular chart example is included in the Pyramid Diagrams solution from the Marketing area of ConceptDraw Solution Park.
Inverted pyramid diagram
Pyramid Diagram

Bar Diagrams for Problem Solving. Create economics and financial bar charts with Bar Graphs Solution

 Line Graphs
How to draw a Line Graph with ease? The Line Graphs solution extends the capabilities of ConceptDraw PRO v10 with professionally designed templates, samples, and a library of vector stencils for drawing perfect Line Graphs.
Flow chart Example. Warehouse Flowchart


- Scatter chart - MENA's (Middle East and North Africa's) real GDP ...
- MENA's (Middle East and North Africa's) real GDP growth - Scatter ...
- How To Draw Gdp Diagram
- How to Draw a Scatter Diagram Using ConceptDraw PRO | Blank ...
- Scatter Graph | Scatter graph - Template | Scatter Graph Charting ...
- Affinity diagram - Business expansion | BPR Diagram. Business ...
- Affinity Diagram | How To Create an Affinity Diagram Using ...
- Image chart - The total financing of the Philippines from 2001-2010 ...
- Basic Diagramming | Line Graphs | Sales Growth. Bar Graphs ...
- Bar Diagrams for Problem Solving. Create economics and financial ...
- Process Flowchart | Business Productivity Diagramming | Flow chart ...
- Seven Management and Planning Tools | Affinity diagram template ...
- Affinity Diagram | Affinity diagram - Implementing continuous ...
- Earthquake disaster assessment - Workflow diagram | Emergency ...
- Scatter Chart Examples | Scatter graphs - Vector stencils library ...
- Pyramid Diagram | Purchase funnel diagram | Funnel diagram ...
- Pyramid Diagram | Global liquidity inverted pyramid diagram ...
- Sales Growth. Bar Graphs Example | Basic Diagramming | Bar ...
- How can you illustrate the weather condition | Chore charts with ...
- Sales Process Flowchart. Flowchart Examples | Global liquidity ...