This pie chart sample shows the atmosphere air composition. It was designed on the base of the Wikimedia Commons file: Air composition pie chart.JPG.
[commons.wikimedia.org/ wiki/ File:Air_ composition_ pie_ chart.JPG]
This file is licensed under the Creative Commons Attribution-Share Alike 3.0 Unported license. [creativecommons.org/ licenses/ by-sa/ 3.0/ deed.en]
"The atmosphere of Earth is a layer of gases surrounding the planet Earth that is retained by Earth's gravity. The atmosphere protects life on Earth by absorbing ultraviolet solar radiation, warming the surface through heat retention (greenhouse effect), and reducing temperature extremes between day and night (the diurnal temperature variation).
The common name given to the atmospheric gases used in breathing and photosynthesis is air. By volume, dry air contains 78.09% nitrogen, 20.95% oxygen, 0.93% argon, 0.039% carbon dioxide, and small amounts of other gases. Air also contains a variable amount of water vapor, on average around 1%. Although air content and atmospheric pressure vary at different layers, air suitable for the survival of terrestrial plants and terrestrial animals currently is only known to be found in Earth's troposphere and artificial atmospheres." [Atmosphere of Earth. Wikipedia]
The pie chart example "Atmosphere air composition" was created using the ConceptDraw PRO diagramming and vector drawing software extended with the Pie Charts solution of the Graphs and Charts area in ConceptDraw Solution Park.
Pie chart

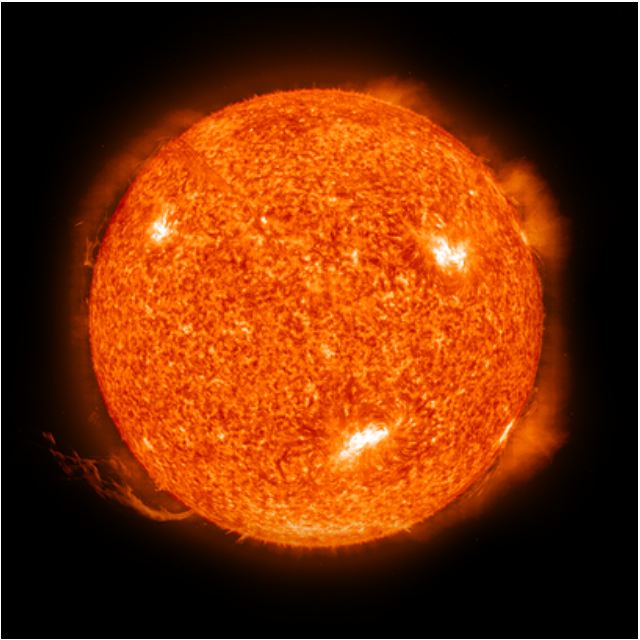
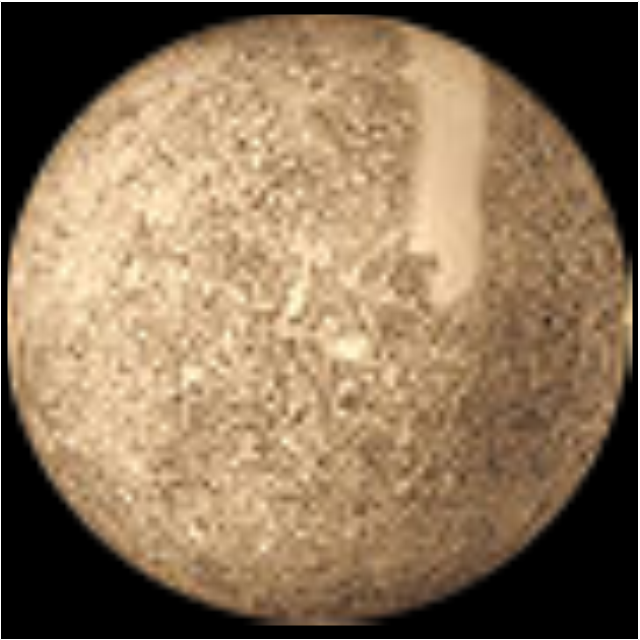
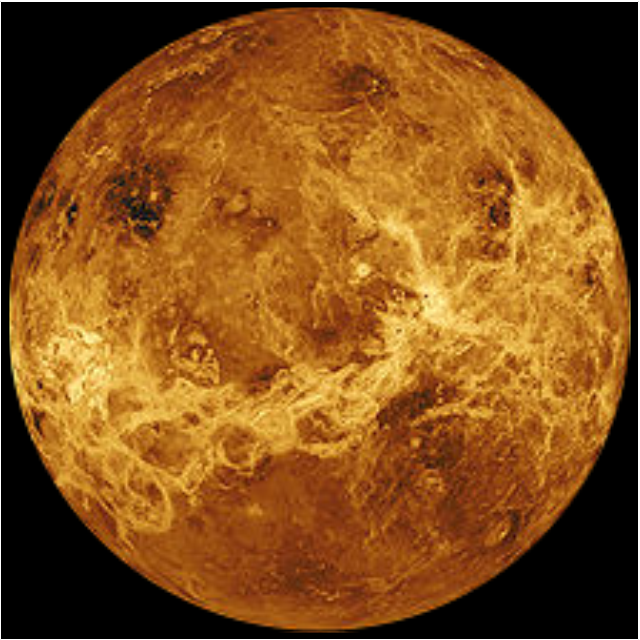
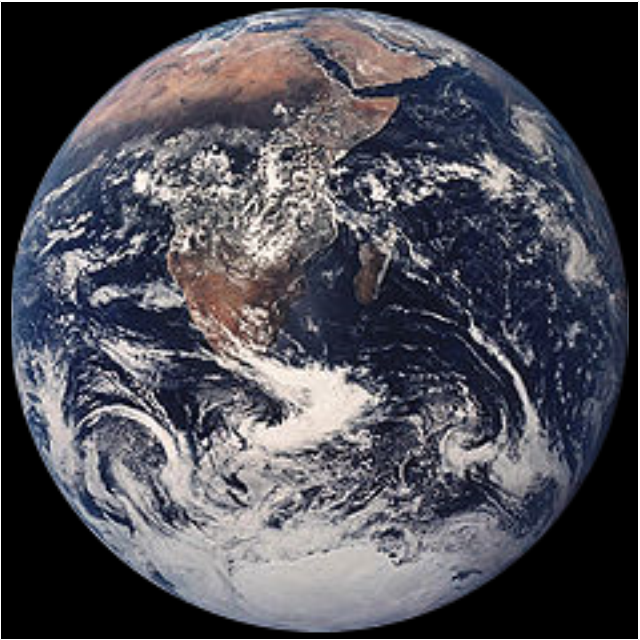
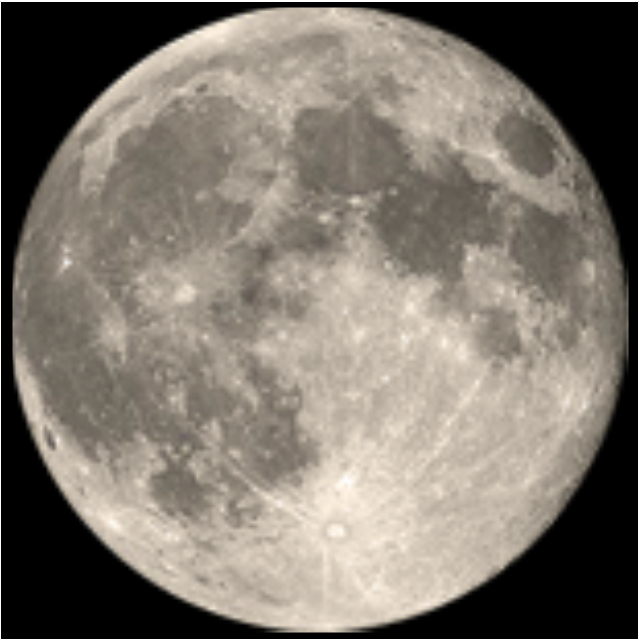
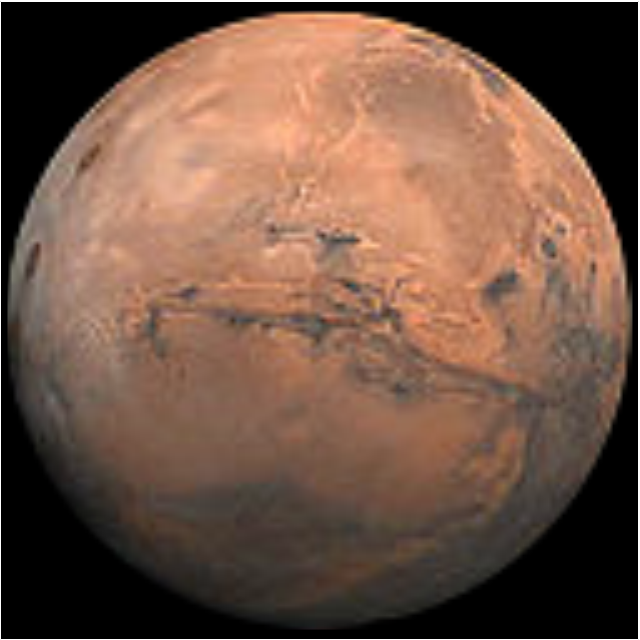
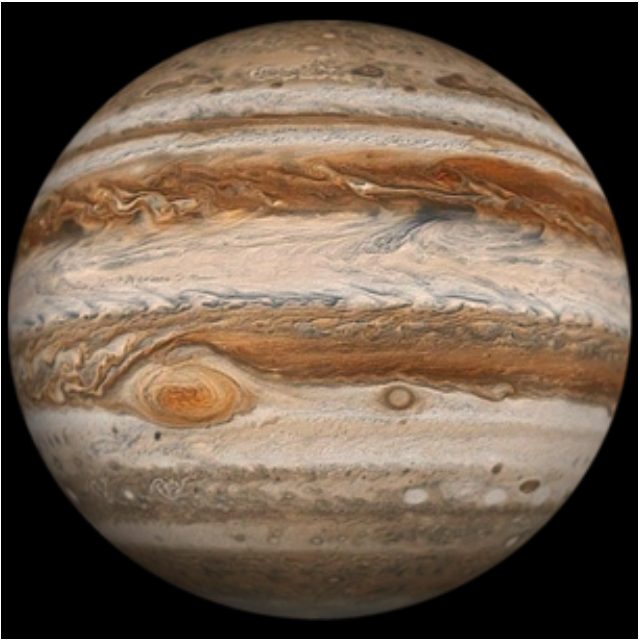
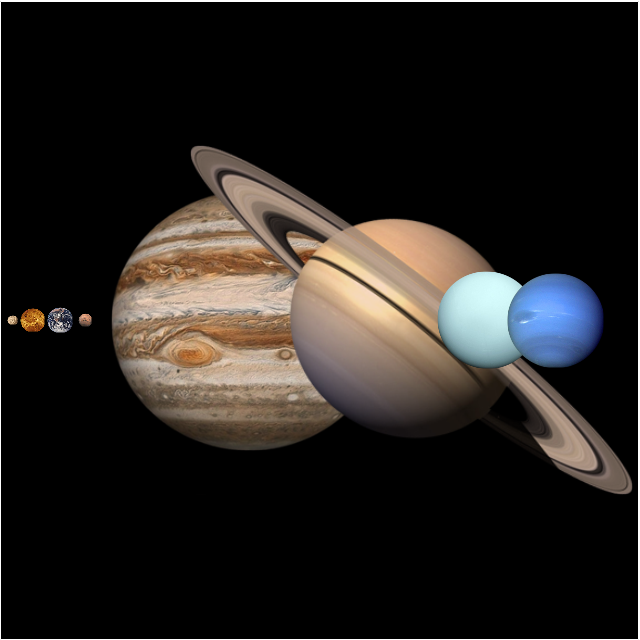
This vector stencils library contains 30 clipart images and astronomical symbols of sun and stars, solar system planets and moon.
Use these shapes for drawing your astronomical diagrams and illustrations.
Use these shapes for drawing your astronomical diagrams and illustrations.
Solar system
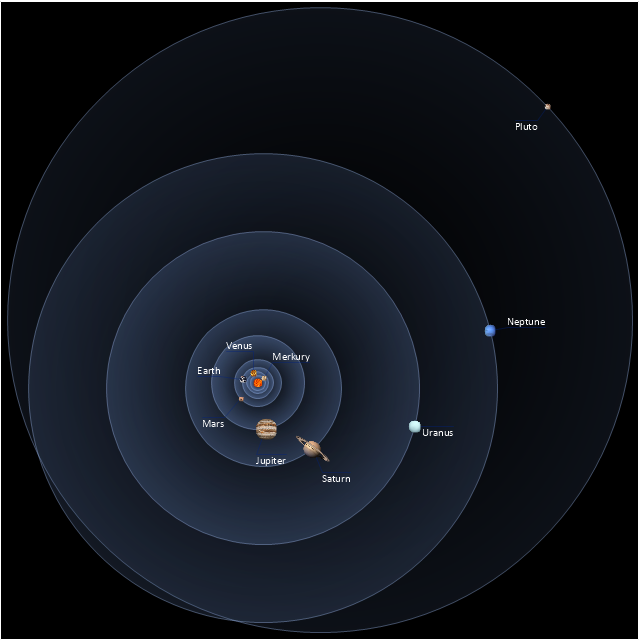
Sun
Mercury
Venus
Earth
Moon
Mars
Jupiter
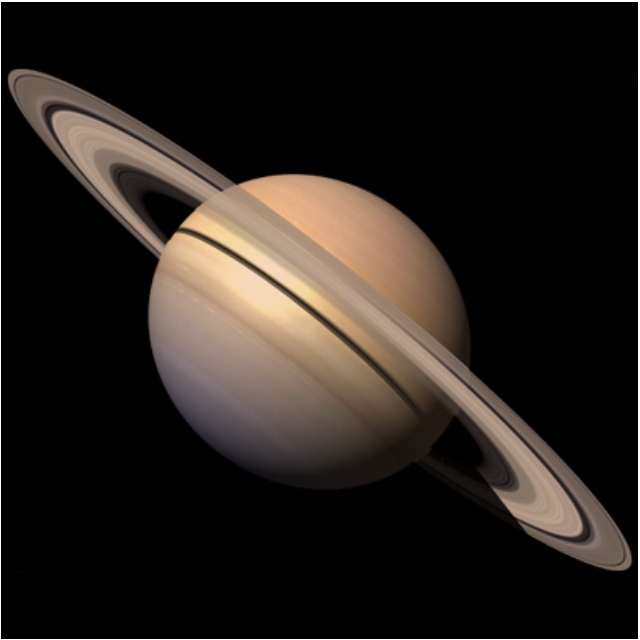
Saturn
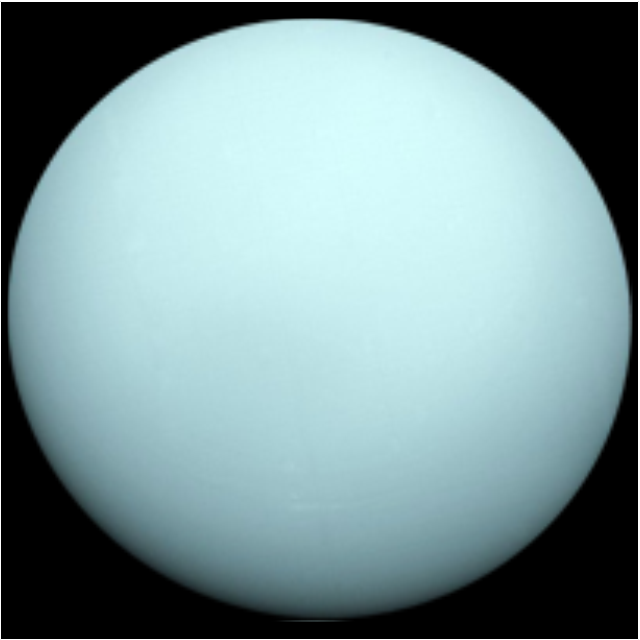
Uranus
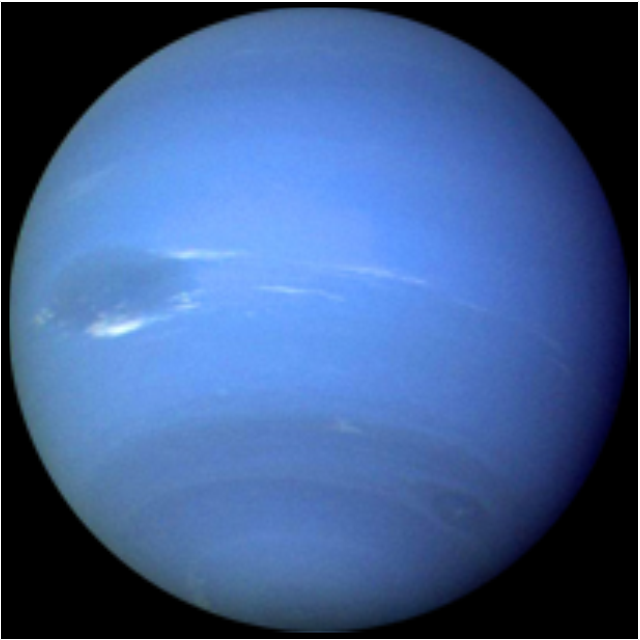
Neptune
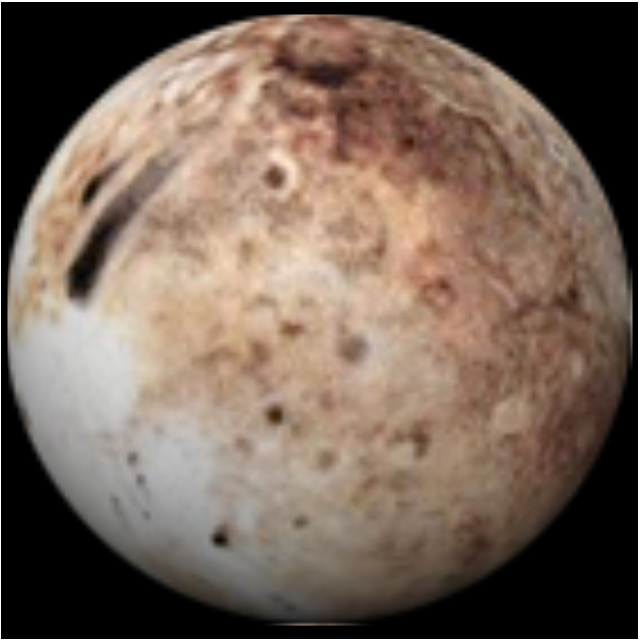
Pluto
Red giant
Yellow giant
Blue giant

Red dwarf
White dwarf

Black hole
Planets to scale
Sun symbol
Mercury symbol
Venus symbol
Earth symbol
Moon symbol

Mars symbol
Jupiter symbol

Saturn symbol

Neptune symbol
Uranus symbol
Pluto symbol

This ecology infographic example was created on the base of the infographics "Greenhouse gas emissions in the EU" from the Debating Europe website. [debatingeurope.eu/ wp-content/ uploads/ 2013/ 06/ TH_ 2_ social.png]
"A greenhouse gas (sometimes abbreviated GHG) is a gas in an atmosphere that absorbs and emits radiation within the thermal infrared range. This process is the fundamental cause of the greenhouse effect. The primary greenhouse gases in the Earth's atmosphere are water vapor, carbon dioxide, methane, nitrous oxide, and ozone. Greenhouse gases greatly affect the temperature of the Earth; without them, Earth's surface would average about 33 °C colder, which is about 59 °F below the present average of 14 °C (57 °F)." [Greenhouse gas. Wikipedia]
The ecology infographic example "EU greenhouse gas emissions" was created using the ConceptDraw PRO diagramming and vector drawing software extended with the Management Infographics solition from the area "Business Infographics" in ConceptDraw Solution Park.
Ecology infographics example

Used Solutions
This vector stencils library contains 30 clipart images and astronomical symbols of sun and stars, solar system planets and moon.
Use these shapes for drawing your astronomical diagrams and illustrations.
Use these shapes for drawing your astronomical diagrams and illustrations.
Solar system
Sun
Mercury
Venus
Earth
Moon
Mars
Jupiter
Saturn
Uranus
Neptune
Pluto
Red giant
Yellow giant
Blue giant
Red dwarf
White dwarf
Black hole
Planets to scale
Sun symbol
Mercury symbol
Venus symbol
Earth symbol
Moon symbol
Mars symbol
Jupiter symbol
Saturn symbol
Neptune symbol
Uranus symbol
Pluto symbol
This Water cycle diagram example was drawn using the ConceptDraw PRO diagramming and vector graphics software extended with the clipart libraries Geography and Weather.
"The water cycle, also known as the hydrologic cycle or the H2O cycle, describes the continuous movement of water on, above and below the surface of the Earth. The mass water on Earth remains fairly constant over time but the partitioning of the water into the major reservoirs of ice, fresh water, saline water and atmospheric water is variable depending on a wide range of climatic variables. The water moves from one reservoir to another, such as from river to ocean, or from the ocean to the atmosphere, by the physical processes of evaporation, condensation, precipitation, infiltration, runoff, and subsurface flow. In so doing, the water goes through different phases: liquid, solid (ice), and gas (vapor)." [Water cycle. Wikipedia]
This water cycle diagram example is included in the Nature solution from the Illustration area of ConceptDraw Solution Park.
Vector illustration

Percentage Pie Chart. Pie Chart Examples

This DFD sample was created on the base of the figure from the NASA website. [asd-www.larc.nasa.gov/ ATBD/ DFD.html]
"Clouds and the Earth's Radiant Energy System (CERES).
EOS-Terra: Understanding Earth's Clouds and Climate.
The Clouds and the Earth's Radiant Energy System (CERES) instrument is one of several that will be flown aboard the Earth Observing System's Terra spacecraft, scheduled for launch in late1999. The data from the CERES instrument will be used to study the energy exchanged between the Sun; the Earth's atmosphere, surface and clouds; and outer space.
The CERES EOS-Terra instrument will be the second CERES instrument in Earth orbit. The first CERES instrument is currently orbiting the Earth aboard the Tropical Rainfall Measuring Mission observatory, which was launched in November 1997. Early results of the TRMM mission show that the first CERES has provided better measurement capabilities than any previous satellite instrument of its kind.
What CERES Will Measure.
CERES will measure the energy at the top of the atmosphere, as well as estimate energy levels in the atmosphere and at the Earth's surface. Using information from very high resolution cloud imaging instruments on the same spacecraft, CERES also will determine cloud properties, including cloud amount, altitude, thickness, and the size of the cloud particles. All of these measurements are critical for advancing our understanding of the Earth's total climate system and further improving climate prediction models.
The CERES instrument is based on NASA Langley's highly successful Earth Radiation Budget Experiment (ERBE) which used three satellites to provide global energy budget measurements from 1984 to 1990." [nasa.gov/ centers/ langley/ news/ factsheets/ CERES.html]
The DFD example "CERES data flow diagram" was created using the ConceptDraw PRO diagramming and vector drawing software extended with the Data Flow Diagrams solution from the Software Development area of ConceptDraw Solution Park.
DFD

"Consumption of energy resources, (e.g. turning on a light) requires resources and has an effect on the environment. Many electric power plants burn coal, oil or natural gas in order to generate electricity for energy needs. While burning these fossil fuels produces a readily available and instantaneous supply of electricity, it also generates air pollutants including carbon dioxide (CO2), sulfur dioxide and trioxide (SOx) and nitrogen oxides (NOx). Carbon dioxide is an important greenhouse gas which is thought to be responsible for some fraction of the rapid increase in global warming seen especially in the temperature records in the 20th century, as compared with tens of thousands of years worth of temperature records which can be read from ice cores taken in Arctic regions. Burning fossil fuels for electricity generation also releases trace metals such as beryllium, cadmium, chromium, copper, manganese, mercury, nickel, and silver into the environment, which also act as pollutants.
The large-scale use of renewable energy technologies would "greatly mitigate or eliminate a wide range of environmental and human health impacts of energy use". Renewable energy technologies include biofuels, solar heating and cooling, hydroelectric power, solar power, and wind power. Energy conservation and the efficient use of energy would also help." [Energy industry. Environmental impact. Wikipedia]
The Energy resources diagram example was created in the ConceptDraw PRO diagramming and vector drawing software using the Manufacturing and Maintenance solution from the Illustration area of ConceptDraw Solution Park.
Infographics

Pie Graph Worksheets

Waterfall Bar Chart

- Atmosphere air composition | Percentage Pie Chart. Pie Chart ...
- Atmosphere air composition | Percentage Pie Chart. Pie Chart ...
- Percentage Pie Chart. Pie Chart Examples | Atmosphere air ...
- Atmosphere air composition | Management Consultant | Draw A Pie ...
- Pie Graph Of Atmosphere Gases
- Atmosphere air composition | CERES data flow diagram | EU ...
- Atmosphere air composition | EU greenhouse gas emissions ...
- Atmosphere air composition | Pie Chart Nitrogen Oxygen ...
- Atmosphere air composition | Drawn Pie Chat Of Greenhose Gases
- Global natural gas consumption | Atmosphere air composition ...