How to Create Presentation of Your Project Gantt Chart
During the planning, discussing and execution of a project you may need to prepare a presentation using project views such as the Gantt Chart, Multiproject Dashboard or Resource Usage View. It’s easy do with ConceptDraw PROJECT!HelpDesk
How to Create a Gantt Chart for Your Project
Instruction on how to create Gantt chart using ConceptDraw PROJECT software. Gant Chart is a graphical representation of tasks as segments on a time scale. It helps plan or overlapping.HelpDesk
How to Plan and Allocate Resources in Your Project on Mac
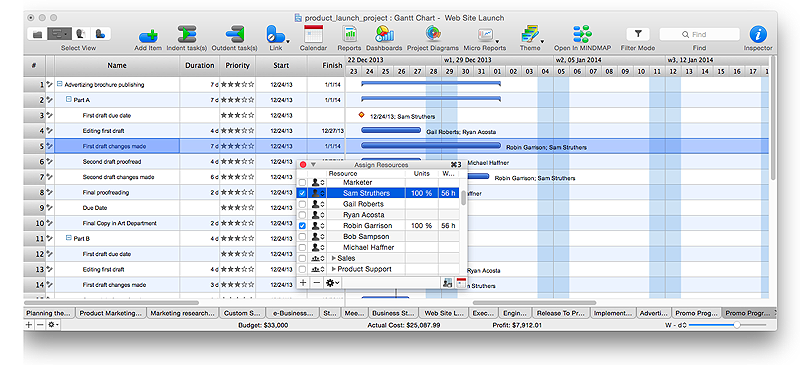
CoceptDraw PROJECT provides easy ways to project Resources Management: Create a list of project resources and assign the right people to tasks, as well as the necessary materials to be used.How to Create Gantt Chart
To begin managing a new project, you will need to define the individual Tasks that must be completed to deliver it. The default view for a new project in ConceptDraw PROJECT is the Gantt Chart.Gantt Chart Diagram
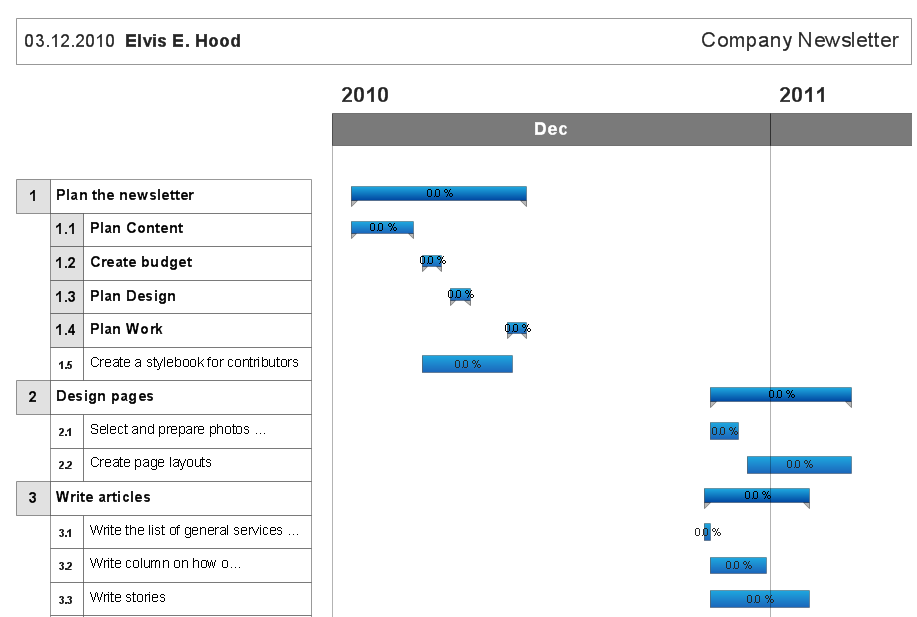
Gantt Chart is a popular type of bar charts and widely used projects planning method. It helps to illustrate the plan for some project, the progress of tasks, the resources planning, the schedule of works and working time. The Gantt Chart contains a set of intervals (bars) located on the time axis and reflects the use of resources by objects. Each bar represents a separate task in the project, its length is a duration of the work. The vertical axis of the graph represents the list of tasks. Besides, the chart can contain additional data, such as the percents of complete, the total tasks, the tasks dependencies, the key points (milestones), etc. The use of Gantt Chart greatly simplifies the project management and enables to visualize in visual and compressed view the most important information of the project, what resources are used for execution the certain tasks and which must to be the speed of their execution. ConceptDraw Office suite applications help to cope perfectly the project management tasks, to construct easily the basic structure of your project and create a Gantt Chart Diagram. PM Easy solution allows you to plan and execute the projects using the mind mapping technique, to implement planning using mind mapping, and track tasks using ConceptDraw Project.Gant Chart in Project Management
Gantt Chart is a graphical representation of tasks as segments on a time scale. It helps plan and monitor project development or resource allocation. There are list of tasks, project milesones and stages. The horizontal axis is a time scale, expressed either in absolute or relative time. Gantt chart can be used for planning in virtually any industry. There are major project planning tools using gantt chart for creating project plan. For instance, using ConceptDraw PROJECT together with ConceptDraw MINDMAP for planning marketing actions is very effective way. It makes ConceptDraw Office best marketing project management software for gantt chart planning marketing message, scheduling stages when to send massive text messages or when use email marketing services in specific projects. There are simple steps on how to use project management software for marketing, sales actions and product support. This is simple all in one toolbox for managers who need best project management software for small business as for planning and brainstorming as for reporting at project execution stage. Using gantt charts together with mindmap visuals and professional presentations charts make it excellent creative project management software. ConceptDraw PROJECT is portfolio project management software it allows manage many projects with multi gantt chart.
Gantt Chart Software
ConceptDraw PROJECT is a powerful Gantt Chart Software. The Gantt Charts are useful for displaying a large amount of detailed information, project tasks and timelines in a visually pleasing, easy-to-understand format. ConceptDraw PROJECT provides wide capabilities of importing and exporting in various formats: Microsoft Project, ConceptDraw MINDMAP, Mindjet MindManager, PDF file.HelpDesk
How to Add a Color Marker to Project Task on a Gantt Chart
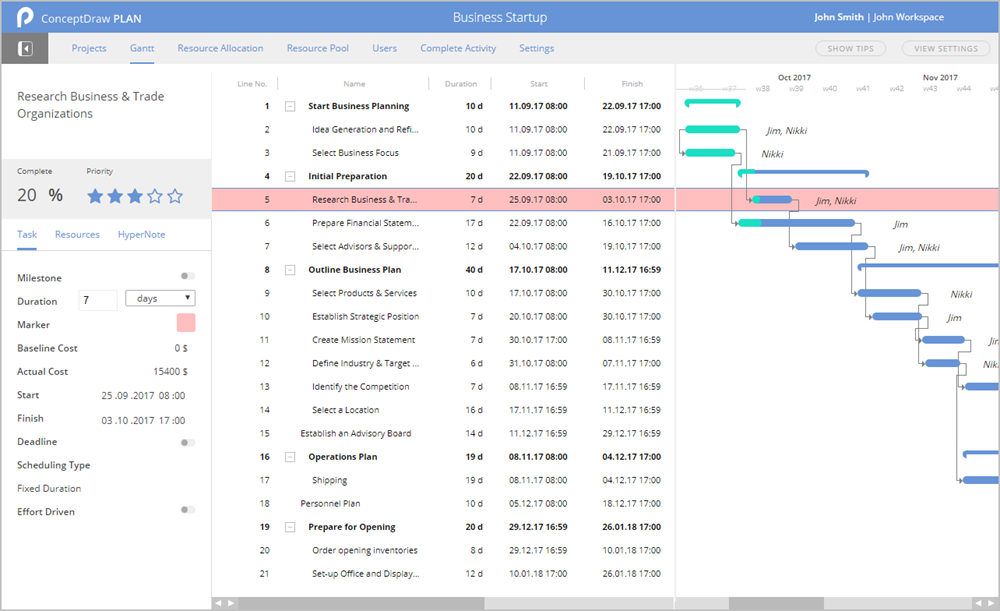
ConceptDraw PLAN allows adding color markers to scheduled project tasks. A color marker is used to show whether a task is marked for further action or identification of some kind. You can use markers if you want to select certain tasks for further viewing, filtering, formatting, or editing in the offline mode.HelpDesk
How to Plan and Allocate Resources in Your Project with ConceptDraw PROJECT for Windows
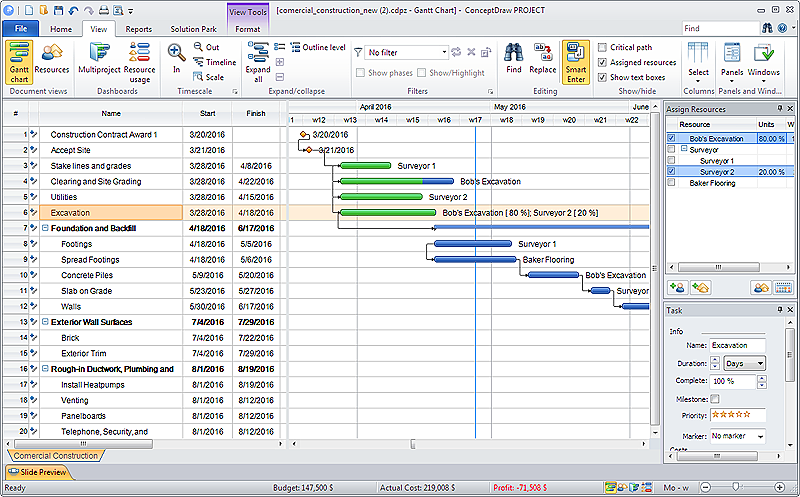
Effective resource management is a key factor in the successful project implementation. The common types of resources for which the project manager has an impact, include material resources (materials, energy), staff (work) and equipment. CoceptDraw PROJECT provides easy ways to project Resources Management: Create a list of project resources and assign the right human resource, as well as the necessary material, or equipment to be used.HelpDesk
What Information to be Displayed in the ConceptDraw PROJECT Gantt Chart View
What information can can contain the project task list? Gantt Chart view is a graphical representation of a project outline that allows one to allocate tasks.You can customize a project’s tasks list view to include the columns you need to meet your information requirements. The columns of the ConceptDraw PROJECT Gantt view contain the information you want to capture about each task in your project. The following article details what information can be contained in the columns of a project outline:<
- Process Flowchart | Manpower Gantt Chart
- Gantt charts for planning and scheduling projects | Gant Chart in ...
- Gantt Chart Assignment
- Manpower Allocation Using Gantt Chart
- Good Flow Chart app for Mac | Gant Chart in Project Management ...
- WBS Diagram | How to Report Task's Execution with Gantt Chart ...
- Responsibility assignment matrix - Central statistical office | | Work ...
- PM Easy | How to Report Task's Execution with Gantt Chart | Product ...
- How to Create Presentation of Your Project Gantt Chart | Gantt chart ...
- Product Overview | How to Report Task's Execution with Gantt Chart ...


