Mind Mapping in the Quality Management
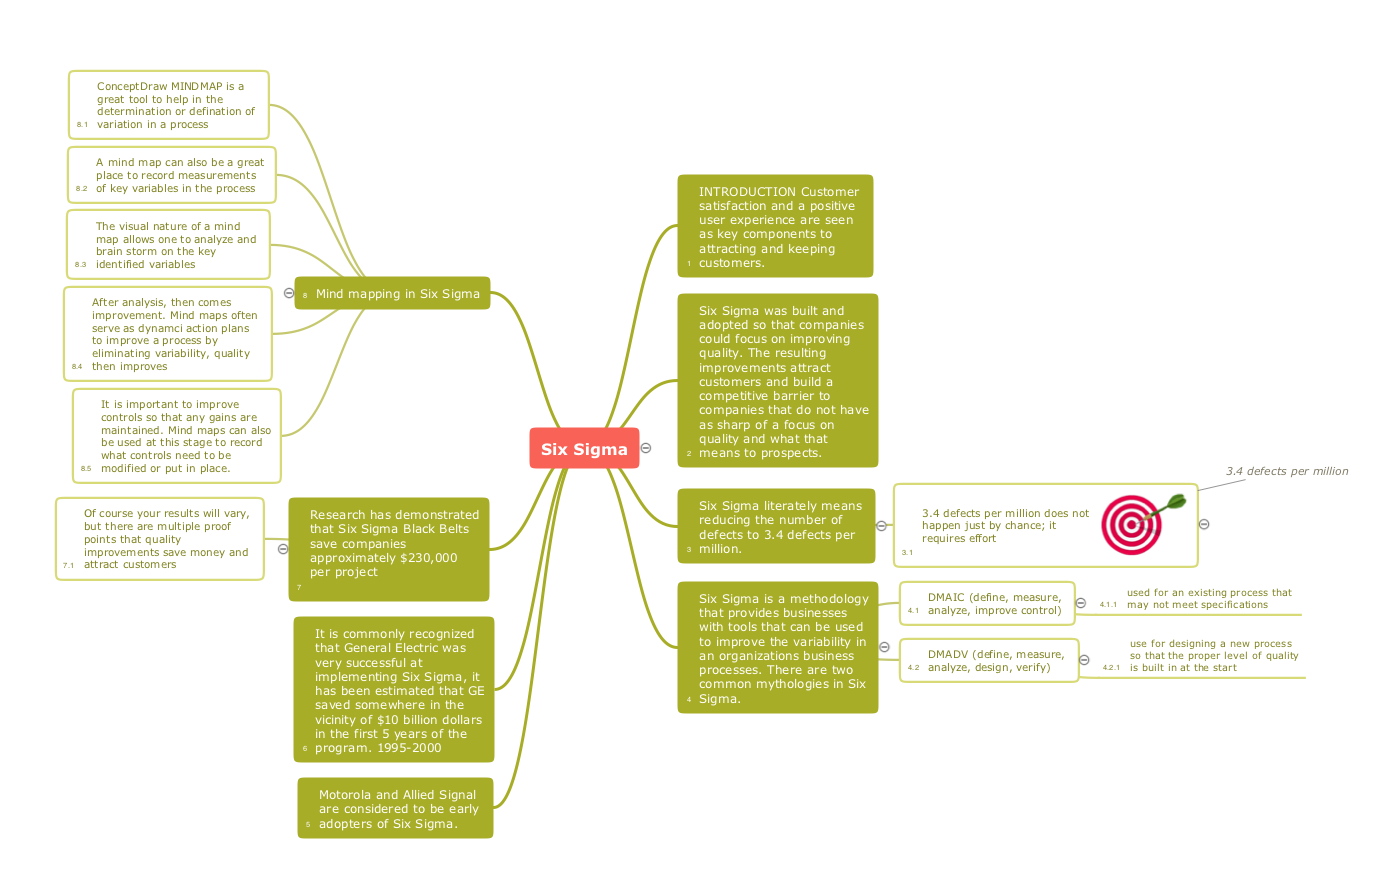
ConceptDraw MINDMAP has a addition to the ConceptDraw Solution Park that provides a creative approach to visualizing quality processes, Quality Mind Map Solution.Constant improvement of key performance indicators
There are available tool to lend a fresh look to quality procedures - ConceptDraw MINDMAP.Quality Mind Maps
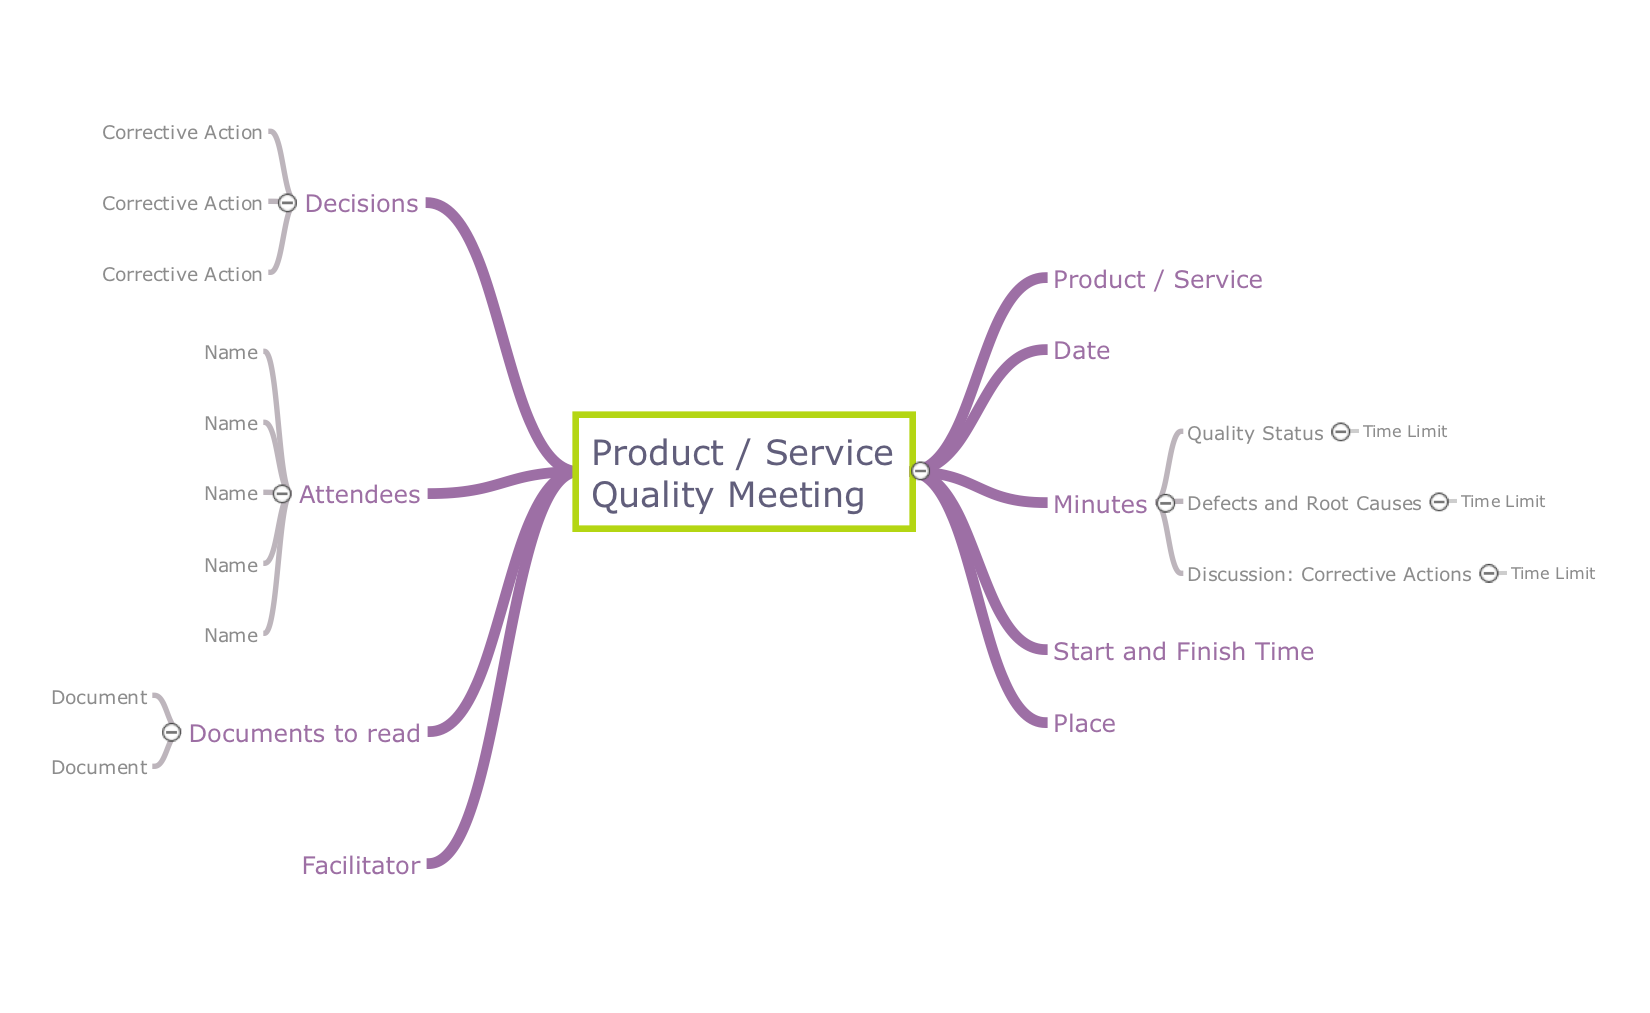
ConceptDraw map templates are great starting points to identify, track, and address quality initiatives in your organization.Quality Improvement
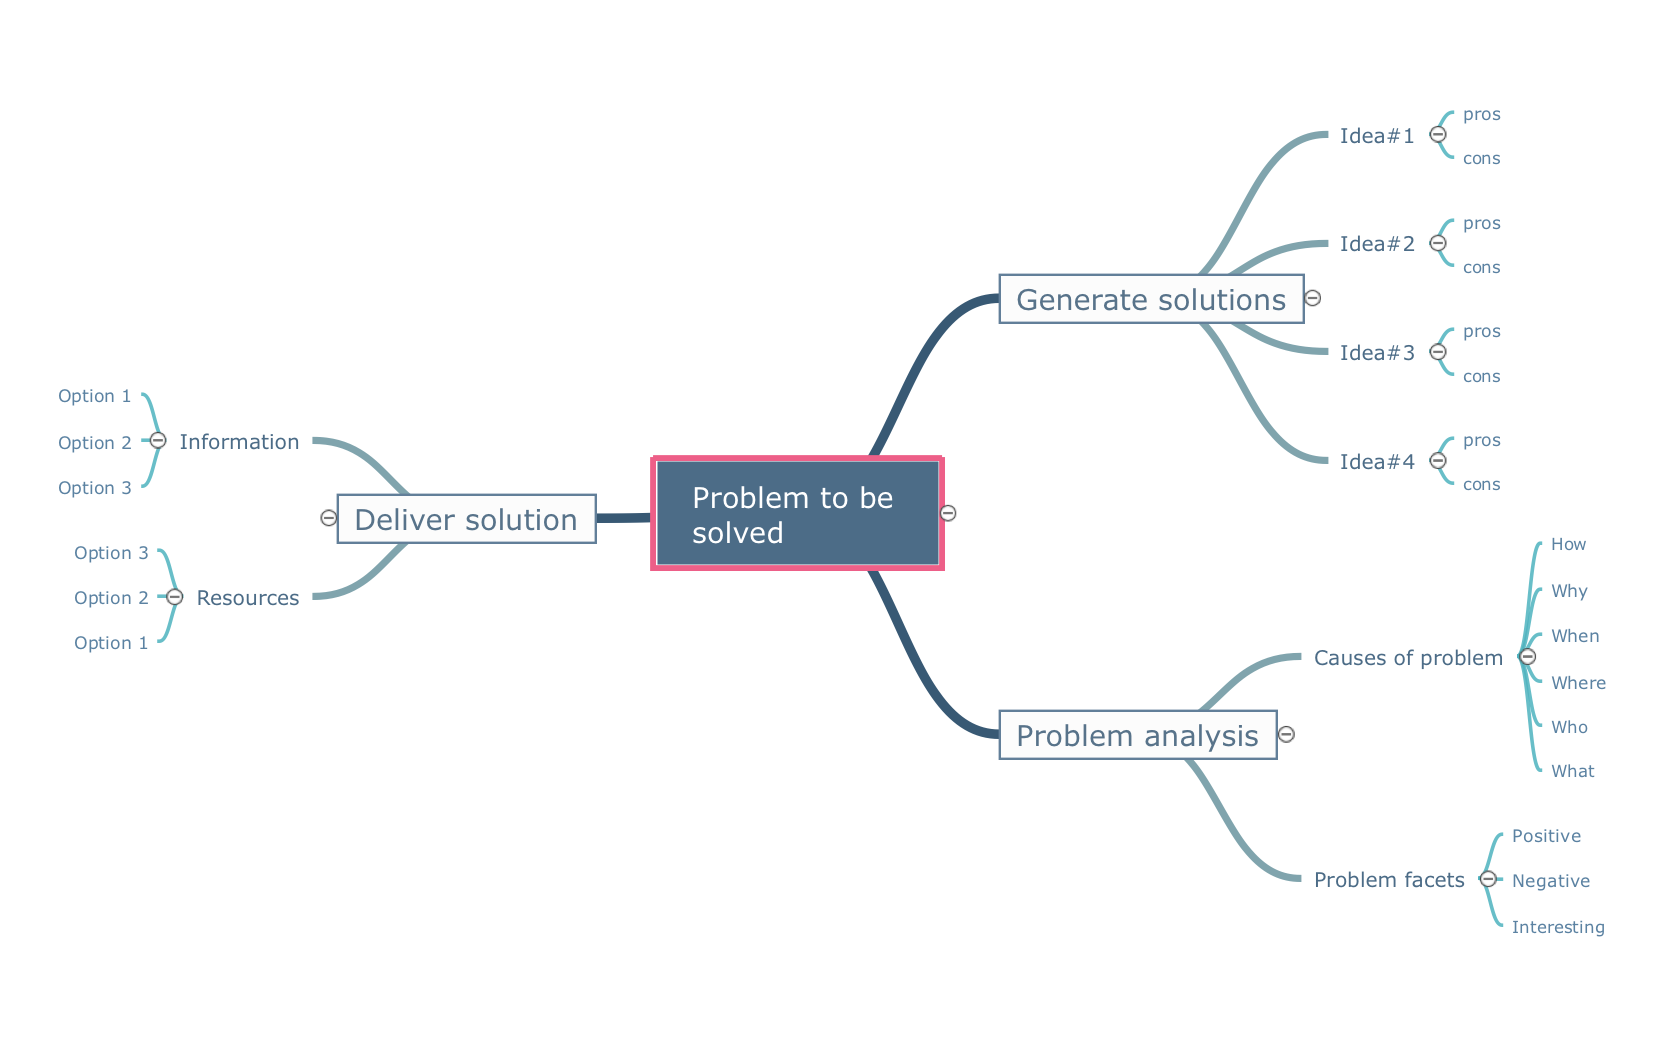
Constant improvement of key performance indicators that are related to quality is a step in the right direction for a company interested in market growth.What is a Quality Management
Successful quality management implemented in a company of any size is a critical component of a company organization.Think. Act. Accomplish.
ConceptDraw MINDMAP is ready to provide you with mind mapping tool which can serve as comprehensive productivity tool for your business.Mac Compatible Remote Presentation
Mac compatible remote presentation, A simple way to share your presentation remotely via Skype. All participants receive presentation file.
TQM Diagram — Professional Total Quality Management
The Total Quality Management Diagram solution helps you and your organization visualize business and industrial processes. Create Total Quality Management diagrams for business process with ConceptDraw software.Business Process Modeling Notation
ConceptDraw PRO is a software for simplу depicting the business processes based on BPMN 2.0. Business Process Diagrams Cross-Functional-Flowcharts, Workflows, Process Charts, IDEF0 and IDEF2, Timeline, Calendars, Gantt Charts, Business Process Modeling, Audit and Opportunity Flowcharts and Mind Maps (presentations, meeting agendas).Bio Flowchart Lite
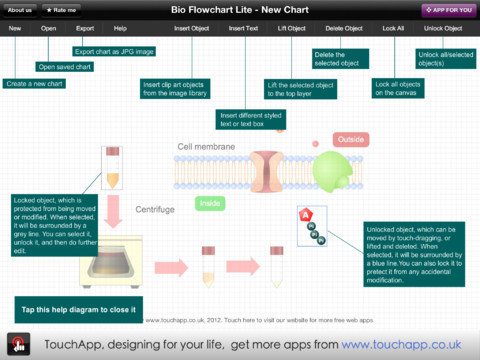
This app targets to help teachers and students to create vivid and professional biological flowcharts and diagrams in an easy way.Value Stream Mapping Symbols
VSM symbols are the best for a production process designing. The entire Value Stream Mapping method uses a graphical representation of the manufacturing process, factors' pros and cons, that all stakeholders can easily understand. Value Stream Mapping is a graphical technique that provides possibilities to improve analysis of a manufacturing process, at the stage of the transferring information or materials that required to deliver a product or service to the customer.Fishbone Diagram Template
A causal model is an abstract concept, that describes the causal mechanisms of a system, by noting certain variables and their influence on each other, in an effort to discover the cause of a certain problem or flaw. This model is presented in diagram form by using a fishbone diagram. ConceptDraw PRO diagramming and vector drawing software enhanced with Fishbone Diagrams solution helps you create business productivity diagrams from Fishbone diagram templates and examples, that provide to start using of the graphic method for the analysis of problem causes. Each predesigned Fishbone Diagram template is ready to use and useful for instantly drawing your own Fishbone Diagram.Business Process Mapping — How to Map a Work Process
ConceptDraw PRO is a world-class diagramming platform that lets you display, communicate, and present dynamically. It′s powerful enough to draw everything from basic flowcharts to complex engineering schematics. Video tutorials on ConceptDraw products. Try it today!TQM Diagram Tool
The Total Quality Management Diagram solution helps you and your organization visualize business and industrial processes. Create Total Quality Management diagrams for business process with ConceptDraw software.- Mind Map Of Companies Transport Fresh Produce
- Conceptdraw.com: Mind Map Software, Drawing Tools | Project ...
- Quality Of Performance Mind Map
- Quality Mind Map | Quality Project Management with Mind Maps ...
- A Creative Look at Quality Procedures | Quality Mind Maps ...
- Quality Mind Maps - samples and templates | Quality Improvement ...
- Mind Map - Quality Structure | Quality Management Teams | Quality ...
- Quality Performance Mind Maps
- Mind Map - Quality Structure | Quality visualization in your company ...
- Quality Management Teams | Helpful in all stages of quality ...
- Quality Improvement | Quality Mind Maps - samples and templates ...
- Organizational Structure Total Quality Management | Best Value ...
- Mind Mapping Of Total Quality In Organizations
- Constant improvement of key performance indicators | Quality Mind ...
- Constant improvement of key performance indicators | TQM Diagram ...
- Mind Map Of Quality Of Perfomance In A Business Example
- Quality Mind Maps - samples and templates | Business Diagram ...
- Constant improvement of key performance indicators | TQM Diagram ...
- TQM Diagram — Professional Total Quality Management | Constant ...
- Creating a default presentation in ConceptDraw MINDMAP | A ...


