This site uses cookies. By continuing to browse the ConceptDraw site you are agreeing to our Use of Site Cookies.

Basic Flowchart Symbols and Meaning

Flowchart Symbols and Meaning - Provides a visual representation of basic flowchart symbols and their proposed use in professional workflow diagram, standard process flow diagram and communicating the structure of a well-developed web site, as well as their correlation in developing on-line instructional projects. See flowchart's symbols by specifics of process flow diagram symbols and workflow diagram symbols.
How to Build a Flowchart

Entity Relationship Diagram Symbols

Creating an entity-relationship (ER) model is to visually represent the structure of a business database, where data equates to entities (or objects) that are linked by defined relationships expressing dependencies and requirements. By nature it is an abstract visualization, the first step in the design process towards creating a logical and functional database.
ERD symbols used for professional ERD drawing are collected in libraries from the Entity-Relationship Diagram (ERD) solution for ConceptDraw DIAGRAM.
HelpDesk

How to Create Flowchart Using Standard Flowchart Symbols

Flowcharts are used to display an algorithm for consistent execution of certain steps. A flowchart is probably the easiest way to make a graphical representation of any process. Flowcharts use the set of standard geometric symbols and arrows to define relationships. ConceptDraw DIAGRAM allows you to create professional flowchart quickly and easily. The ability to create flowcharts is contained in the Flowcharts solution. The solution provides a set of special tools for creating flowcharts.

ERD Symbols and Meanings

Crow's foot notation is used in Barker's Notation, Structured Systems Analysis and Design Method (SSADM) and information engineering. Crow's foot diagrams represent entities as boxes, and relationships as lines between the boxes. Different shapes at the ends of these lines represent the cardinality of the relationship.
The Chen's ERD notation is still used and is considered to present a more detailed way of representing entities and relationships.
To create an ERD, software engineers mainly turn to dedicated drawing software, which contain the full notation resources for their specific database design - ERD symbols and meanings. CS Odessa has released an all-inclusive Entity-Relationship Diagram (ERD) solution for their powerful drawing program, ConceptDraw DIAGRAM.
How to Build an Entity Relationship Diagram (ERD)

Flow Chart Symbols

Flowcharts are used in designing and documenting simple processes or programs. Like other types of diagrams, they help visualize what is going on and thereby help understand a process, and perhaps also find flaws, bottlenecks, and other less-obvious features within it. There are many different types of flowcharts, and each type has its own repertoire of boxes and notational conventions.
Flowchart diagrams consists of symbols of process, decision, data and document, data base, termination or initiation processes, processing loops and conditions. To create an drawn flowchart use professional flowchart maker of ConceptDraw DIAGRAM.

Workflow Diagram Data

Workflow Diagram created by using special software based on graphic mastering technology Arrows10. Its automatics follows the global concept of business graphics and diagramming. The practical effectiveness of Arrows10 technology used in ConceptDraw DIAGRAM are around the quick auto-arrows behaving as expected and connecting boxes of workflow diagram from workflow symbol to process flow symbol.

ConceptDraw DIAGRAM is a workflow diagram software contains specific features help you to draw diagrams faster, such as RapidDraw, or Arrows10. There is also a rich set of samples and templates to give you an example of data may be visualized as workflow diagram.

Data Flow Diagram Symbols. DFD Library

Data Flow Diagrams show information transfers and process steps of a system. The general concept is an approach of a depicting how occurs input in a system, further processes and what runs out. The aim of DFD is in accomplishing of understanding between developers and users. Data flow diagrams are maintained with other methods of structured systems analysis.

Flowchart

With ConceptDraw DIAGRAM it is easy to create professional flowchart diagrams of any complexity. With the use of numerous templates and the extensive libraries of ready-made symbols and blocks; depicting your business processes has never been easier.

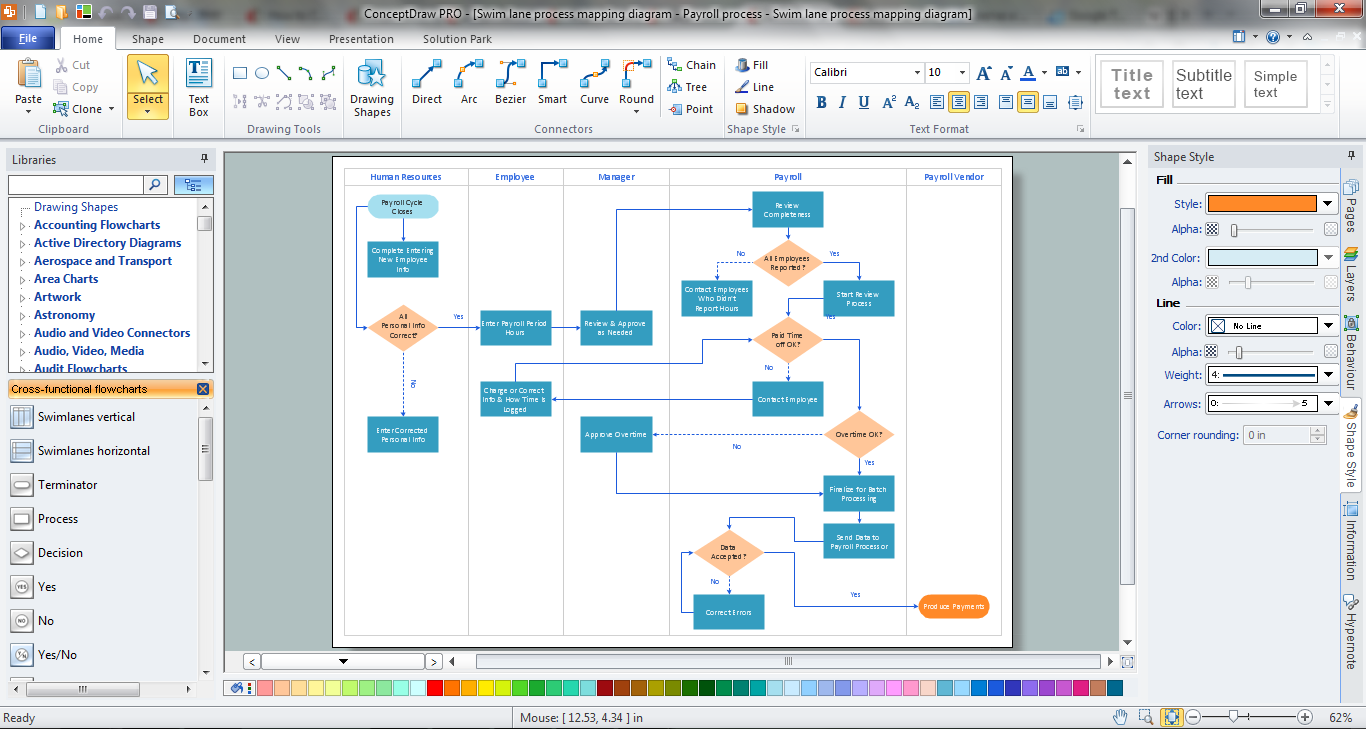
Cross Functional Flowchart Symbols

The excellent possibility to create attractive Cross Functional Flowcharts for step-by-step visualization the operations of a business process flow of any degree of detailing is offered by ConceptDraw’s Cross-Functional Flowcharts solution. The extensive selection of commonly used vector cross functional flowchart symbols allow you to demonstrate the document flow in organization, to represent each team member’s responsibilities and how processes get shared or transferred between different teams and departments.

Cross Functional Flowchart

ConceptDraw DIAGRAM extended with Cross-Functional Flowcharts Solution from the Business Processes Area is the best software for quick and easy designing Cross Functional Flowchart of any complexity. Make sure in it right now!