Audit Process Flowchart. Audit Flowchart
Audit Process Flowchart, Audit Flowchart - Audit Flowcharts solution for ConceptDraw PRO Solution Park provides the Audit Flowcharts library with wide variety of predesigned audit flowchart symbols, and also the set of templates and samples allowing you design your own audit flowchart or audit process flowchart in one moment. Simply use any of offered samples and change it for your needs, or fill the desired template.Audit Flowchart Symbols
The audit is a complex process consisting of defined quantity of steps, which have as a final goal the ensuring of success of a certain business project. It includes the independent examination of data, statements and financial performances of an enterprise for a stated purpose. It is convenient to construct the Audit Flowcharts or Audit Diagrams for visual representation and structuring the audit processes. ConceptDraw PRO diagramming software enhanced with Audit Flowcharts solution from the Finance and Accounting area of ConceptDraw Solution Park effectively helps to draw the Audit Diagrams for accounting, finance and money management, the Audit Flowcharts for fiscal information tracking, financial inventories and documenting Six Sigma, the decision making Flow Charts, etc. This solution provides the powerful drawing tools, numerous templates and samples, and large quantity of vector audit flowchart symbols that greatly facilitate the process of representation the audit steps and audit results, and designing efficient and visually appealing Audit Flowcharts.Copying Service Process Flowchart. Flowchart Examples
This sample was created in ConceptDraw PRO diagramming and vector drawing software using the Flowcharts solution from the Diagrams area of ConceptDraw Solution Park. This sample shows the Flowchart on that it is displayed the process of the determination the permissibility according the Access Copyright license. The diamonds represent the decision points. Inside the diamonds are the questions that need the answer yes/no. It is necessary to answer on the question, make the decision that will determine the next step.HelpDesk
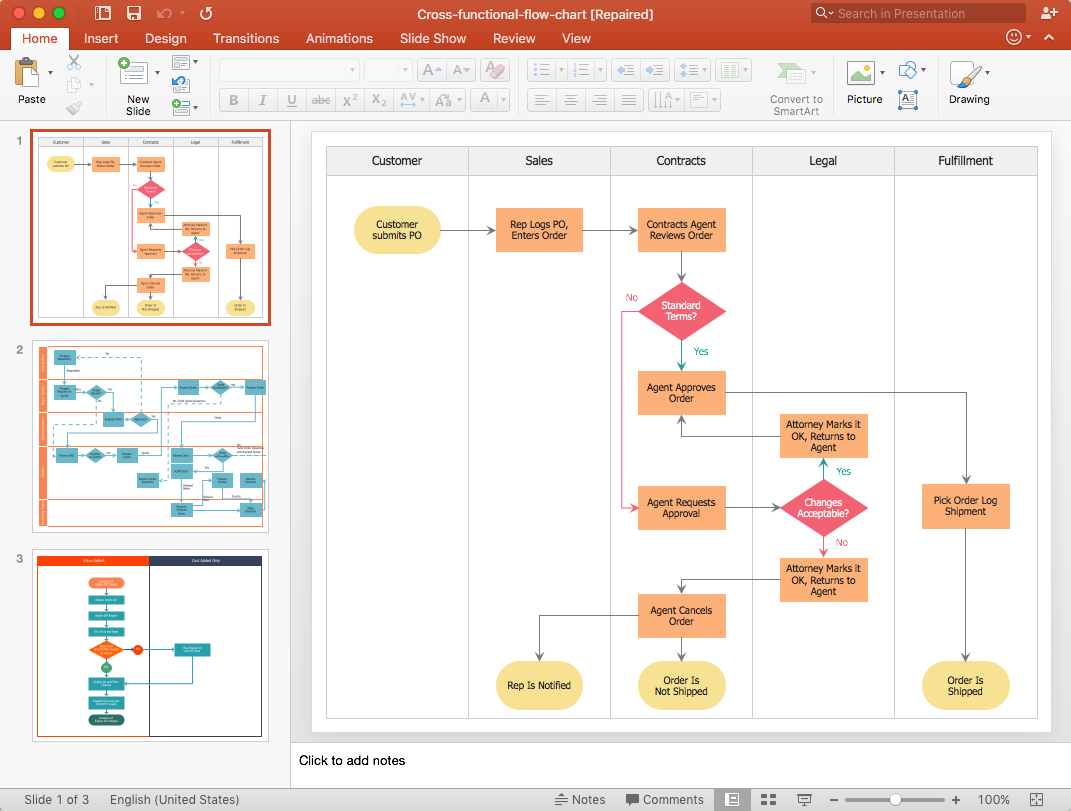
How to Add a Cross-Functional Flowchart to a PowerPoint Presentation
Using a Cross-Functional flowchart is a clear way of showing how business processes get shared or transferred between different teams and departments. ConceptDraw PRO allows you to make an MS PowerPoint Presentation from your flowcharts in a few simple steps.How to Create Flowcharts for an Accounting Information System
Accounting information is a system of interrelated processes which represent financial and accounting data, required for decision making. For representing the accounting processes in a visual and easy for perception form are constructed Accounting Flowcharts. For their creation are used special flowchart symbols, this makes Accounting flowcharts understandable for all users of accounting information system and helps them easy understand the sequence of steps involved to accounting processes. But how to create Flowcharts for an Accounting Information System fast and easy? Use of special design software is useful for this. ConceptDraw PRO software extended with Accounting Flowcharts solution is the best for creation accurate Accounting Flowcharts, for documentation and visually communication on how accounting processes work, how each operation is done. Accounting Flowcharts solution is supplied with library of predesigned commonly used vector symbols, Accounting Flowchart templates and samples demonstrating receiving, purchasing, payment, and other accounting processes.Flow Chart for Olympic Sports
Sports Selection Flow Chart - This sample was created in ConceptDraw PRO using the Flowcharts Solution from the Marketing Area and shows the Flow Chart of sport selection. An experienced user spent 10 minutes creating this sample.Steps in the Accounting Process
Steps in the Accounting Process - The Accounting Process is a sequence of organization activities that is used for gaining quantitative information about the finances. This complex process consists of a set of sequential steps. 9 steps in the accounting process: Analysis of Business Transactions, Make Journal Entries, Post to Ledger Accounts, Prepare Trial Balance, Make Adjusting Entries, Adjusted Trial Balance, Prepare Financial Statements, Close Accounts, Post-Closing Trial Balance.Basic Audit Flowchart. Flowchart Examples
This sample shows the Audit Process Flowchart. It was created in ConceptDraw PRO diagramming and vector drawing software using the Flowcharts solution from the Diagrams area of ConceptDraw Solution Park. The Audit Flowcharts are widely used in the financial management, accounting, money management and in many others fields.HelpDesk
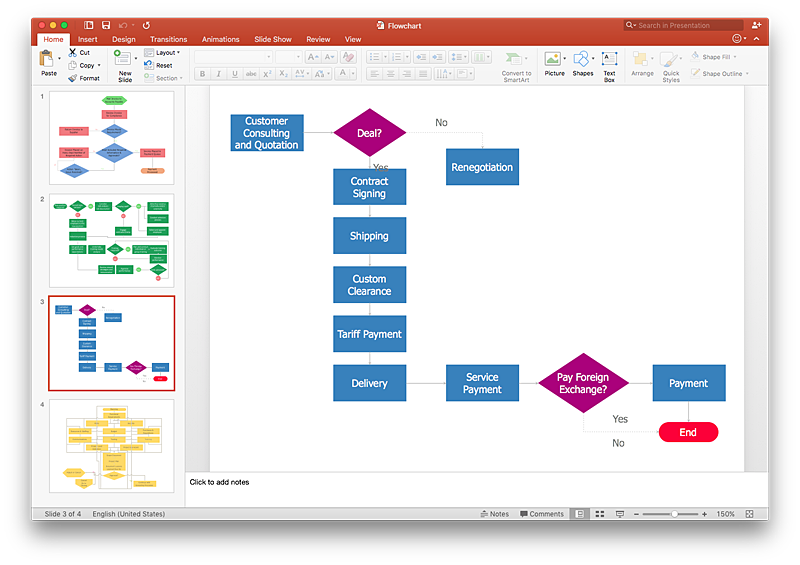
How To Make a PowerPoint Presentation of Flowcharts
ConceptDraw PRO allows you to create professional flowchart quickly and easily. The ability to create flowcharts is contained in the Flowcharts solution. To submit flowcharts for the audience, you can use export to MS PowerPoint.Contoh Flowchart
The Flowcharts are graphical representations of algorithms, processes or step-by-step solutions problems. There are many different types of Flowcharts, among them Process Flowchart, Cross Functional Flowchart, Data Flow Diagram, IDEF Flowchart, Workflow Diagram, Contoh Flowchart and many others. They have especial value when you need represent a complex process, depict in details the process of solution problems, efficiently plan and set the tasks priorities. The Flowcharts must to be constructed brief, clear and logical, simplifying the process or procedure, and making easier the comprehension and perception of information. The ConceptDraw PRO software makes the process of creating the flowcharts of any types well organized and clear for developers and customers also, including the Contoh Flowchart. It is possible due to the Flowcharts solution from ConceptDraw Solution Park, its predesigned vector objects, templates, and a lot of professional-looking practical samples and examples which can be quick and easy modified, printed, or published on web.Flowchart Software
The Flowcharts are popular and widely used for designing, documenting, managing and analyzing the complex processes and programs in various fields, such as science, business, engineering, architecture, manufacturing, administration, and many others. To design professional looking Flowchart Diagrams we recommend to use the ConceptDraw PRO diagramming and vector drawing software extended with set of Flowchart maker solutions from the Diagrams, Finance and Accounting, Marketing, and Business Processes areas of ConceptDraw Solution Park. ConceptDraw PRO flowchart software is rich for the libraries of ready-to-use predesigned vector flowchart objects, templates, samples and examples, which make it the best choice for designing the Flowcharts of any type and style. Besides, the ConceptDraw documents with Flowchart Diagrams are vector graphic documents, available for reviewing, modifying and converting to different popular formats: image, HTML, PDF file, MS PowerPoint Presentation, Adobe Flash or MS Visio XML.Basic Flowchart Symbols and Meaning
Flowcharts are the best for visually representation the business processes and the flow of a custom-order process through various departments within an organization. ConceptDraw PRO diagramming and vector drawing software extended with Flowcharts solution offers the full set of predesigned basic flowchart symbols which are gathered at two libraries: Flowchart and Flowcharts Rapid Draw. Among them are: process, terminator, decision, data, document, display, manual loop, and many other specific symbols. The meaning for each symbol offered by ConceptDraw gives the presentation about their proposed use in professional Flowcharts for business and technical processes, software algorithms, well-developed structures of web sites, Workflow diagrams, Process flow diagram and correlation in developing on-line instructional projects or business process system. Use of ready flow chart symbols in diagrams is incredibly useful - you need simply drag desired from the libraries to your document and arrange them in required order. There are a few serious alternatives to Visio for Mac, one of them is ConceptDraw PRO. It is one of the main contender with the most similar features and capabilities.
Swim Lanes Flowchart. Flowchart Examples
This sample was created in ConceptDraw PRO diagramming and vector drawing software using the Cross-Functional Flowcharts solution from the Business Processes area of ConceptDraw Solution Park. This sample shows the Swim Lanes Flowchart of Identification and logging.
Purchase Process Flow Chart, Receiving Process Flow Chart, Accounting Flowchart Example.
The purchasing process follows very specific guidelines and includes a purchasing cycle flowchart and receiving process flow chart. Common key elements of purchasing process. It is important to know how purchasing processes work and how each operation is done.Purchasing Flow Chart. Purchasing Flowchart Example
This sample shows the Purchasing Flow Chart Diagram that displays the money flow in the carbon offset sphere. The carbon offsets are the compensatory measures that the companies make for the carbon emissions. You can see on this sample the groups that have interests in the carbon offsets and the money flow after the carbon offset vendors sold the carbon offsets.- Pdf Types Power Point Accounting Presentation
- How to Create a PowerPoint Presentation from a SWOT Analysis ...
- How to Add a Workflow Diagram to a PowerPoint Presentation ...
- How to Add a Cross-Functional Flowchart to a PowerPoint ...
- Mechanical Engineering | Process Flowchart | Electrical Diagram ...
- Warehouse Ppt Templates Pdf Download
- Power Point Presentation For A Deployment Flowchart
- Process Flow Powerpoint Presentations Samples
- Quality In Manufacturing Pdf And Ppt
- Organizational Chart Templates | Flowchart Software ...
- How To Do A Mind Map In PowerPoint | Organizational Chart ...
- How to Import a PowerPoint Presentation to ConceptDraw ...
- Tows Matrix Ppt
- Contoh Flowchart Untuk Powerpoint
- Powerpoint Flowchart Templates Free Download
- How to Create Multipage Diagram | How to Add a Cross-Functional ...
- Basic Flowchart Symbols and Meaning | Process Flowchart | Gane ...
- Mechanical Drawing Symbols | Process Flowchart | CAD Drawing ...
- Sales Analysis Presentation Pdf
- How to Create a PowerPoint Presentation from a SWOT Analysis ...


