HelpDesk
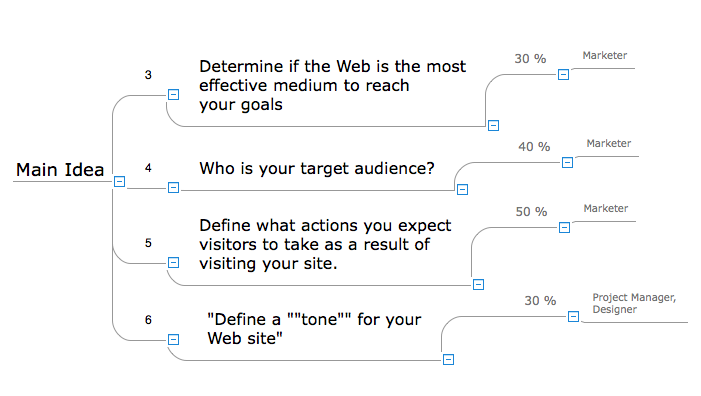
How to Input Data from MS Excel Into a Mind Map
Flowchart design. Flowchart symbols, shapes, stencils and icons


Flow chart Example. Warehouse Flowchart


Process Flow Diagram Symbols

Process Flowchart


Functional Flow Block Diagram

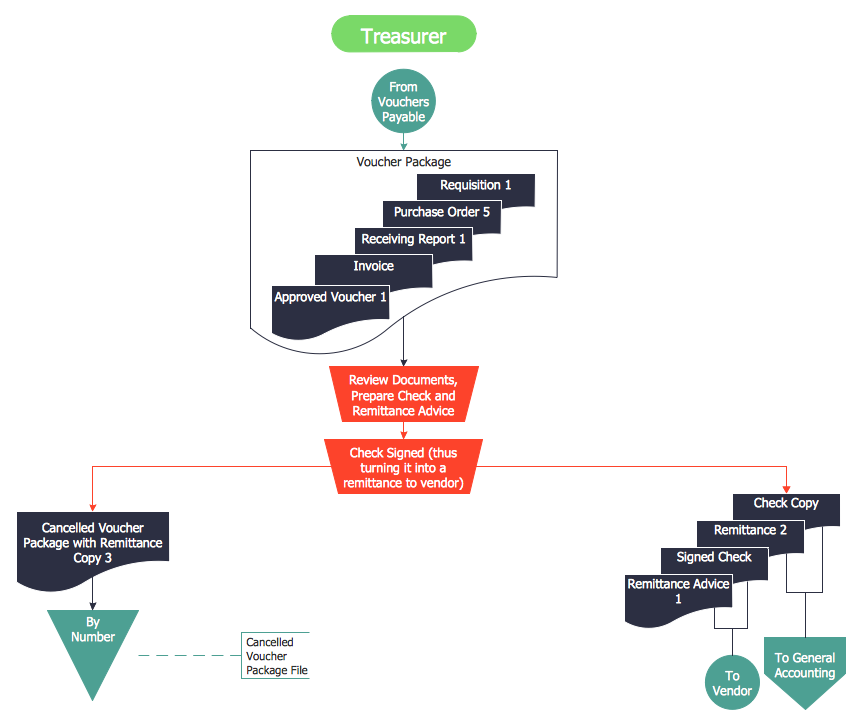
Accounts Payable Process Flow Chart
Risk Diagram (Process Decision Program Chart)

Entity Relationship Diagram Symbols

Pyramid Diagram

- Cross-Functional Flowchart (Swim Lanes) | Swim Lane Diagrams ...
- Cross Functional Flowchart Template Excel
- Download Work Flow Chart Excel
- Purchase Flowchart Excel
- Flow Chart Excel
- Purchases Payable Payment Process Flowchart Template In Excel
- Swim Lane Diagram Template Excel
- Flow chart Example. Warehouse Flowchart | Design Organogram ...
- Basic Flowchart Symbols and Meaning | Excel Double Arrows ...
- Designing Templates On Excel On Quality