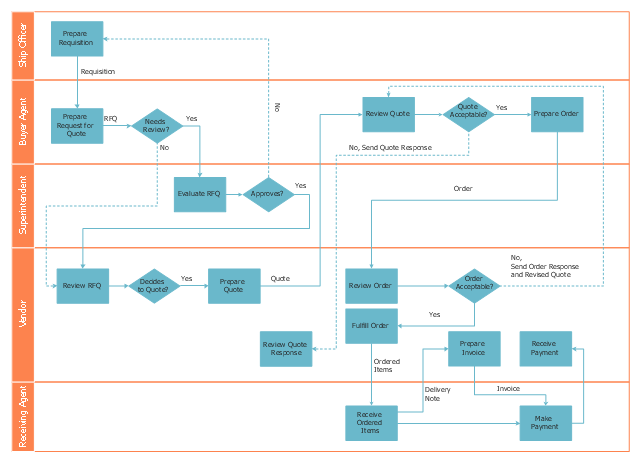
This deployment flow chart sample shows the trading process flow.
"Trade, also called goods exchange economy, is to transfer the ownership of goods from one person or entity to another by getting something in exchange from the buyer. Trade is sometimes loosely called commerce or financial transaction or barter. A network that allows trade is called a market. ...
Modern traders ... generally negotiate through a medium of exchange, such as money. As a result, buying can be separated from selling, or earning. ...
Retail trade consists of the sale of goods or merchandise from a very fixed location, such as a department store, boutique or kiosk, or by mail, in small or individual lots for direct consumption by the purchaser. Wholesale trade is defined as the sale of goods that are sold merchandise to retailers, to industrial, commercial, institutional, or other professional business users, or to other wholesalers and related subordinated services." [Trade. Wikipedia]
The swim lane diagram example "Deployment flowchart - Trading process diagram" was created using the ConceptDraw PRO diagramming and vector drawing software extended with the Cross-Functional Flowcharts solution from the Business Processes area of ConceptDraw Solution Park.
ConceptDraw DIAGRAM Compatibility with MS Visio
For those who are migrating from MS Visio to ConceptDraw DIAGRAM, or for those who have colleagues and clients who use Visio, ConceptDraw DIAGRAM is compatible with MS Visio.VSDX formatted files.VSDX is Visio’s open XML file format, and it can be easily imported and exported by ConceptDraw DIAGRAM.ConceptDraw Arrows10 Technology
You want to connecting objects manually?You don't know how should diagramming software work?
Is it possible to develop a diagram as quickly as the ideas come to you?
Yes. The innovative ConceptDraw Arrows10 Technology - This is more than enough versatility to draw any type of diagram with any degree of complexity.
You can start draw your diagram manually now.
Sales Process
ConceptDraw DIAGRAM is effective software for a variety of activity fields. Now, extended with Sales Flowcharts solution from the Marketing area of ConceptDraw Solution Park it become also useful in the field of sales. It helps to design professional looking Sales Flowcharts, Sales Process Flowcharts, Sales Process Maps, Plans and Diagrams to effectively realize the process of selling a product or service, and to display the sales results.Flowchart Symbols Accounting. Activity-based costing (ABC) flowchart
This flow chart example represent activity-based costing flowchart (ABC flowchart): resource-catagories, resource cost drivers, activities, activity cost drivers, cost objects, direct materials, direct labour. This sort of accounting flowcharts intended to explain how costs distributed between company units and departments. There is only way to clearly explain activity-based cost distribution - create cost diagram demonstrating cost distribution relations and logics. ConceptDraw DIAGRAM is special software with accounting flowchart symbols and flowchart stencils for effective drawing activity-based cost flowcharts (ABC-flowcharts).UML Activity Diagram. Design Elements
UML Activity Diagram illustrate the business and operational step-by-step workflow of components in a system and shows the overall flow of control.Network Topologies
Running your own business or working for some company as IT specialist, one day you definitely face the need of connecting all network and computer devices existing on this enterprise's balance sheet. Especially once this company grows you need more stuff and so elements of network such as laptops, servers, scanners, printers, fax machines, telephones, routers, so you definitely have to make network topology flowchart to arrange it all correctly to connect it with each other. In this case to use ConceptDraw DIAGRAM as a tool to make your topology diagram is the best decision ever! Test how simple it is to use our samples to create your diagrams in a short term! Whether you need to make logical or physical topologies you can always use the service of our software and with help of libraries to design whatever you need. The basic topologies types are: ring, mesh, bus, star, tree or fully connected one, and its examples are there in Solutions waiting for you on this site to use it all. Check it out and enjoy simplicity of using this application right now!Activity Network Diagram Method
Activity Network Diagram - This sample was created in ConceptDraw DIAGRAM diagramming and vector drawing software using the Seven Management and Planning Tools solution from the Management area of ConceptDraw Solution Park.This sample shows the PERT (Program Evaluation Review Technique) chart of the request on proposal. A request for proposal (RFP) is a request of the company or the organization to potential suppliers to submit the business proposals for service or goods that it is interested to purchase. The RFP is represented on the initial procurement stage and allows to define the risks and benefits.
Chart Software for Better Presentations
Easy charting software comes with beautiful chart templates and examples. This makes it easy to create professional charts without prior experience.Graphs and Charts Area provide a wide collection of professional looking predesigned templates, samples and ready-to-use vector stencils that will help you to draw the charts and diagrams of various types: Pie Charts, Donut Charts, Line Charts, Column Charts, Bar Charts, Pyramids, Scatter Charts, Venn Diagrams, Spider Charts, Area Charts, Divided Bar Graphs.
Organizational Structure Total Quality Management
The Total Quality Management Diagram solution helps you and your organization visualize business and industrial processes. Create Total Quality Management diagrams for business process with ConceptDraw software.Organogram Software
Organizing process is the process of creating the organizational structure of an enterprise. The organizing process consists of several stages. First, you need to divide the organization into departments, respectively to strategies, and then establish relationships of authority. After that, managing director delegates his rights and authorities.HelpDesk
How to Connect Objects on PC
ConceptDraw DIAGRAM provides a few options for drawing connections between objects: Direct Connectors,Smart, Arc, Bezier, Curve and Round Connectors. You can connect objects in your ConceptDraw drawing with proper connectors using the embedded automatic connection modes. This article describes how you can connect objects with connectors and how you can describe different types and behaviors.
Create Organizational Chart
CSOdessa team is happy to provide cost effective Organizational Chart Software for companies of any size. It is a ConceptDraw DIAGRAM extended with Organizational Charts Solution from the Management Area.ConceptDraw DIAGRAM organizational chart professional software allows quickly create organizational charts, flow charts, time lines, and much more. Use it for drawing organizational chart for any size company and analyzing organizational structure. Use ConceptDraw to create organizational chart, visualize company Organizational chart, hospital Organizational chart, hotel Organizational chart, corporate organizational chart, etc.
Seven Basic Tools of Quality — Quality Control
ConceptDraw DIAGRAM diagramming and vector drawing software extended with Seven Basic Tools of Quality solution from the Quality area of ConceptDraw Solution Park provides effective tools for quality control and helps design any types of quality-related diagrams.Business Processes
The most worked out and commonly used methodology of business processes description is IDEF methodology. Besides business processes it allows to describe functional blocks, for example production and marketing. ConceptDraw lets creation of business processes description using IDEF0 and IDEF2 methods.- Basic Flowchart Symbols and Meaning | Audit Flowchart Symbols ...
- Flow Chart Of Direct Selling
- Trading process diagram - Deployment flowchart | Settlement ...
- Flowchart Marketing Process. Flowchart Examples | Process ...
- Sales Process Flowchart . Flowchart Examples | Sales Process ...
- Process Flowchart | Types of Flowcharts | Flow chart Example ...
- Invoice payment process - Flowchart | Accounting Flowchart ...
- Sales Process Flowchart . Flowchart Examples | Basic Flowchart ...
- Accounting Flowchart Symbols | Basic Flowchart Symbols and ...
- Process Flowchart | Basic Flowchart Symbols and Meaning ...
- Basic Flowchart Symbols and Meaning | Cross-Functional Flowchart ...
- Flow chart Example. Warehouse Flowchart | Material Requisition ...
- Trading process diagram - Deployment flowchart | Cross-Functional ...
- Process Flowchart | Flow chart Example. Warehouse Flowchart ...
- Accounting Flowchart Symbols | Invoice payment process ...
- Trading process diagram - Deployment flowchart | Flow chart ...
- Marketing Diagrams | Process Flowchart | Flow chart Example ...
- Cross-Functional Flowchart | Project Timeline | Flowchart Definition ...
- Process Flowchart | Flow chart Example. Warehouse Flowchart ...
- ERD | Entity Relationship Diagrams, ERD Software for Mac and Win
- Flowchart | Basic Flowchart Symbols and Meaning
- Flowchart | Flowchart Design - Symbols, Shapes, Stencils and Icons
- Flowchart | Flow Chart Symbols
- Electrical | Electrical Drawing - Wiring and Circuits Schematics
- Flowchart | Common Flowchart Symbols