This site uses cookies. By continuing to browse the ConceptDraw site you are agreeing to our Use of Site Cookies.

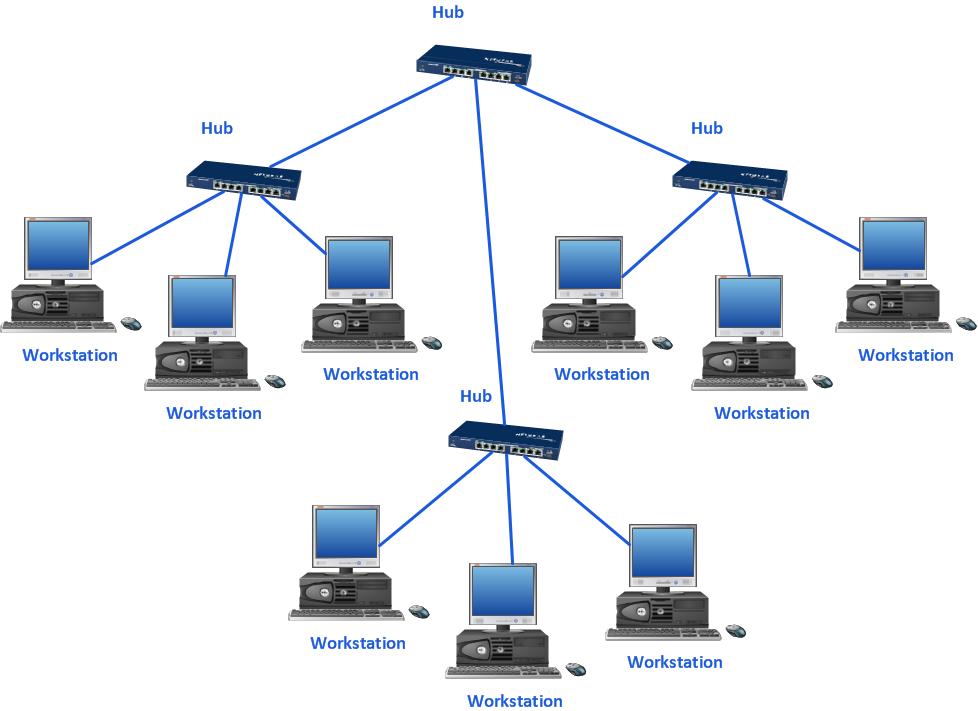
Personal area (PAN) networks. Computer and Network Examples

A Personal area network (PAN) is a computer network that is used for data transmission between different personal devices (computers, telephones, digital devices, etc.) and for connecting to the higher level network and Internet. PANs can be wired with computer buses (USB and FireWire). A wireless personal area network (WPAN) can be made using the network technologies such as Bluetooth, IrDa, UWB, Z-Wave, ZigBee, Body Area Network. A personal area network handles the interconnection of IT devices at the surrounding of a single user. Generally, PAN contains from following such appliances: cordless mice and keyboards, cordless phone, Bluetooth handsets.
This example was created in ConceptDraw DIAGRAM using the Computer and Networks Area of ConceptDraw Solution Park and shows the Personal area network.

Network Diagram Software

ConceptDraw DIAGRAM is the best network diagram software that allows to draw Logical Network Diagram, Network Communication Plan, Network Floor Plan Layout, Active Directory Diagram, Cisco Network Diagram, LAN and WAN Diagram.

Our network drawing software has numerous network design diagram examples and templates:
GPRS Network Scheme,
GPS Operation Diagram,
Hybrid Network Diagram,
Mobile Satellite Communication Network,
Mobile TV Network Diagram,
Web-based Network Diagram,
Wireless Broadband Network Diagram,
Wireless Router Network Diagram.

You can use the more than 2 000 pre-designed stencils for making custom network diagrams.

fishbone diagram, Ishikawa diagram, cause and effect analysis Fishbone Diagram

fishbone diagram, Ishikawa diagram, cause and effect analysis
Fishbone Diagrams solution extends ConceptDraw DIAGRAM software with templates, samples and library of vector stencils for drawing the Ishikawa diagrams for cause and effect analysis.

fishbone diagram, Ishikawa diagram, cause and effect analysis Fishbone Diagrams

fishbone diagram, Ishikawa diagram, cause and effect analysis
The Fishbone Diagrams solution extends ConceptDraw DIAGRAM software with the ability to easily draw the Fishbone Diagrams (Ishikawa Diagrams) to clearly see the cause and effect analysis and also problem solving. The vector graphic diagrams produced using this solution can be used in whitepapers, presentations, datasheets, posters, and published technical material.

Value Stream Mapping Icons

The library with 40 vector stencils is included in the ConceptDraw Value Stream Mapping solution.
HelpDesk

How to Create a Fishbone (Ishikawa) Diagram Quickly

A Fishbone (Ishikawa) diagram is also called a cause-and-effect diagram. Fishbone diagram is often used in business to determine the cause of some problem. The diagram illustrates the main causes and sub-causes leading to an event. The main goal of the Fishbone diagram is to illustrate in a graphical way the relationship between a given outcome and all the factors that influence this outcome. The complete diagram resembles a fish skeleton as its name implies. The ability to create a Fishbone Diagram is supported by the Fishbone Diagram solution. Use ConceptDraw MINDMAP for structuring data and then ConceptDraw DIAGRAM for generating a Fishbone Diagram from mind map structure.
HelpDesk

How To Create Cause and Effect (Fishbone) Diagram in MS Visio

Cause-and-Effect Ishikawa Diagram is a graphical method of analysis and cause-effect relationships, a tool in the form of fish bone. It is used to systematically determine the cause of the problem and represent it graphically. The technique is primarily used in the framework of quality management for the analysis of quality problems and their causes. Nowadays, it has found worldwide distribution and is used in multiple problem areas. It is one of the tools of lean manufacturing, which is used in group work to find the problems and their causes. ConceptDraw DIAGRAM allows you to easily create Fishbone (Ishikawa) diagram and then make an MS Visio VSDX, or VSD files from your diagrams in a couple clicks, using the export capabilities of ConceptDraw DIAGRAM.
HelpDesk

How to Draw a Fishbone Diagram

Fishbone (Ishikawa) Diagram is often used in business to determine the cause of some problem. A Fishbone diagram is also called a cause-and-effect diagram. The main goal of the Fishbone diagram is to illustrate in a graphical way the relationship between a given outcome and all the factors that influence this outcome. The complete diagram resembles a fish skeleton as its name implies. Cause and Effect analysis is used in management to identify the possible causes of a problem in order to eliminate them. The ability to create a Fishbone Diagram is supported by the Fishbone Diagram solution.
HelpDesk

How To Convert a Fishbone Diagram to Adobe PDF

ConceptDraw DIAGRAM allows you to easy transmit visual documentation between different computers with different operating systems and applications using its export capabilities. You can get clear business documentation pack in pdf format and easily communicate it with stakeholders.
HelpDesk

How to Add a Fishbone Diagram to PowerPoint Presentation

Fishbone (Ishikawa) diagram is often used in business to determine the cause of some problems. The easiest way to draw a Fishbone diagram is using ConceptDraw Fishbone Diagram solution.

Mac Diagramming Software

ConceptDraw DIAGRAM software is the best Mac diagramming software for drawing any type of diagrams. Its rich set of samples and templates, and specific features to draw with great visual appeal on Mac OS X.

Cause and Effect Diagram

ConceptDraw DIAGRAM software extended with Fishbone Diagrams solution from the Management area of ConceptDraw Solution Park is perfect for Cause and Effect Diagram creating. It gives the ability to draw fishbone diagram that identifies many possible causes for an effect or a problem. Causes and Effects are usually grouped into major categories to identify these sources of variation. Causes and Effects in the diagram show relationships among various factor. Fishbone diagram shows factors of Equipment, Process, People, Materials, Environment and Management, all affecting the overall problem.

Preventive Action

Preventive Action - ConceptDraw OFFICE suite is a software for the Preventive Action making. The Seven Management and Planning Tools solution is a set of such tools for problems preventive actions via investigating of the core problem.
Skilled use of these diagrams makes collaborative teamwork both more engaging and more effective.

ConceptDraw Solution Park ConceptDraw Solution Park

ConceptDraw Solution Park
ConceptDraw Solution Park collects graphic extensions, examples and learning materials