 ConceptDraw Solution Park
ConceptDraw Solution Park collects graphic extensions, examples and learning materials
 Fishbone Diagram
Fishbone Diagrams solution extends ConceptDraw PRO software with templates, samples and library of vector stencils for drawing the Ishikawa diagrams for cause and effect analysis.
Network Visualization with ConceptDraw PRO
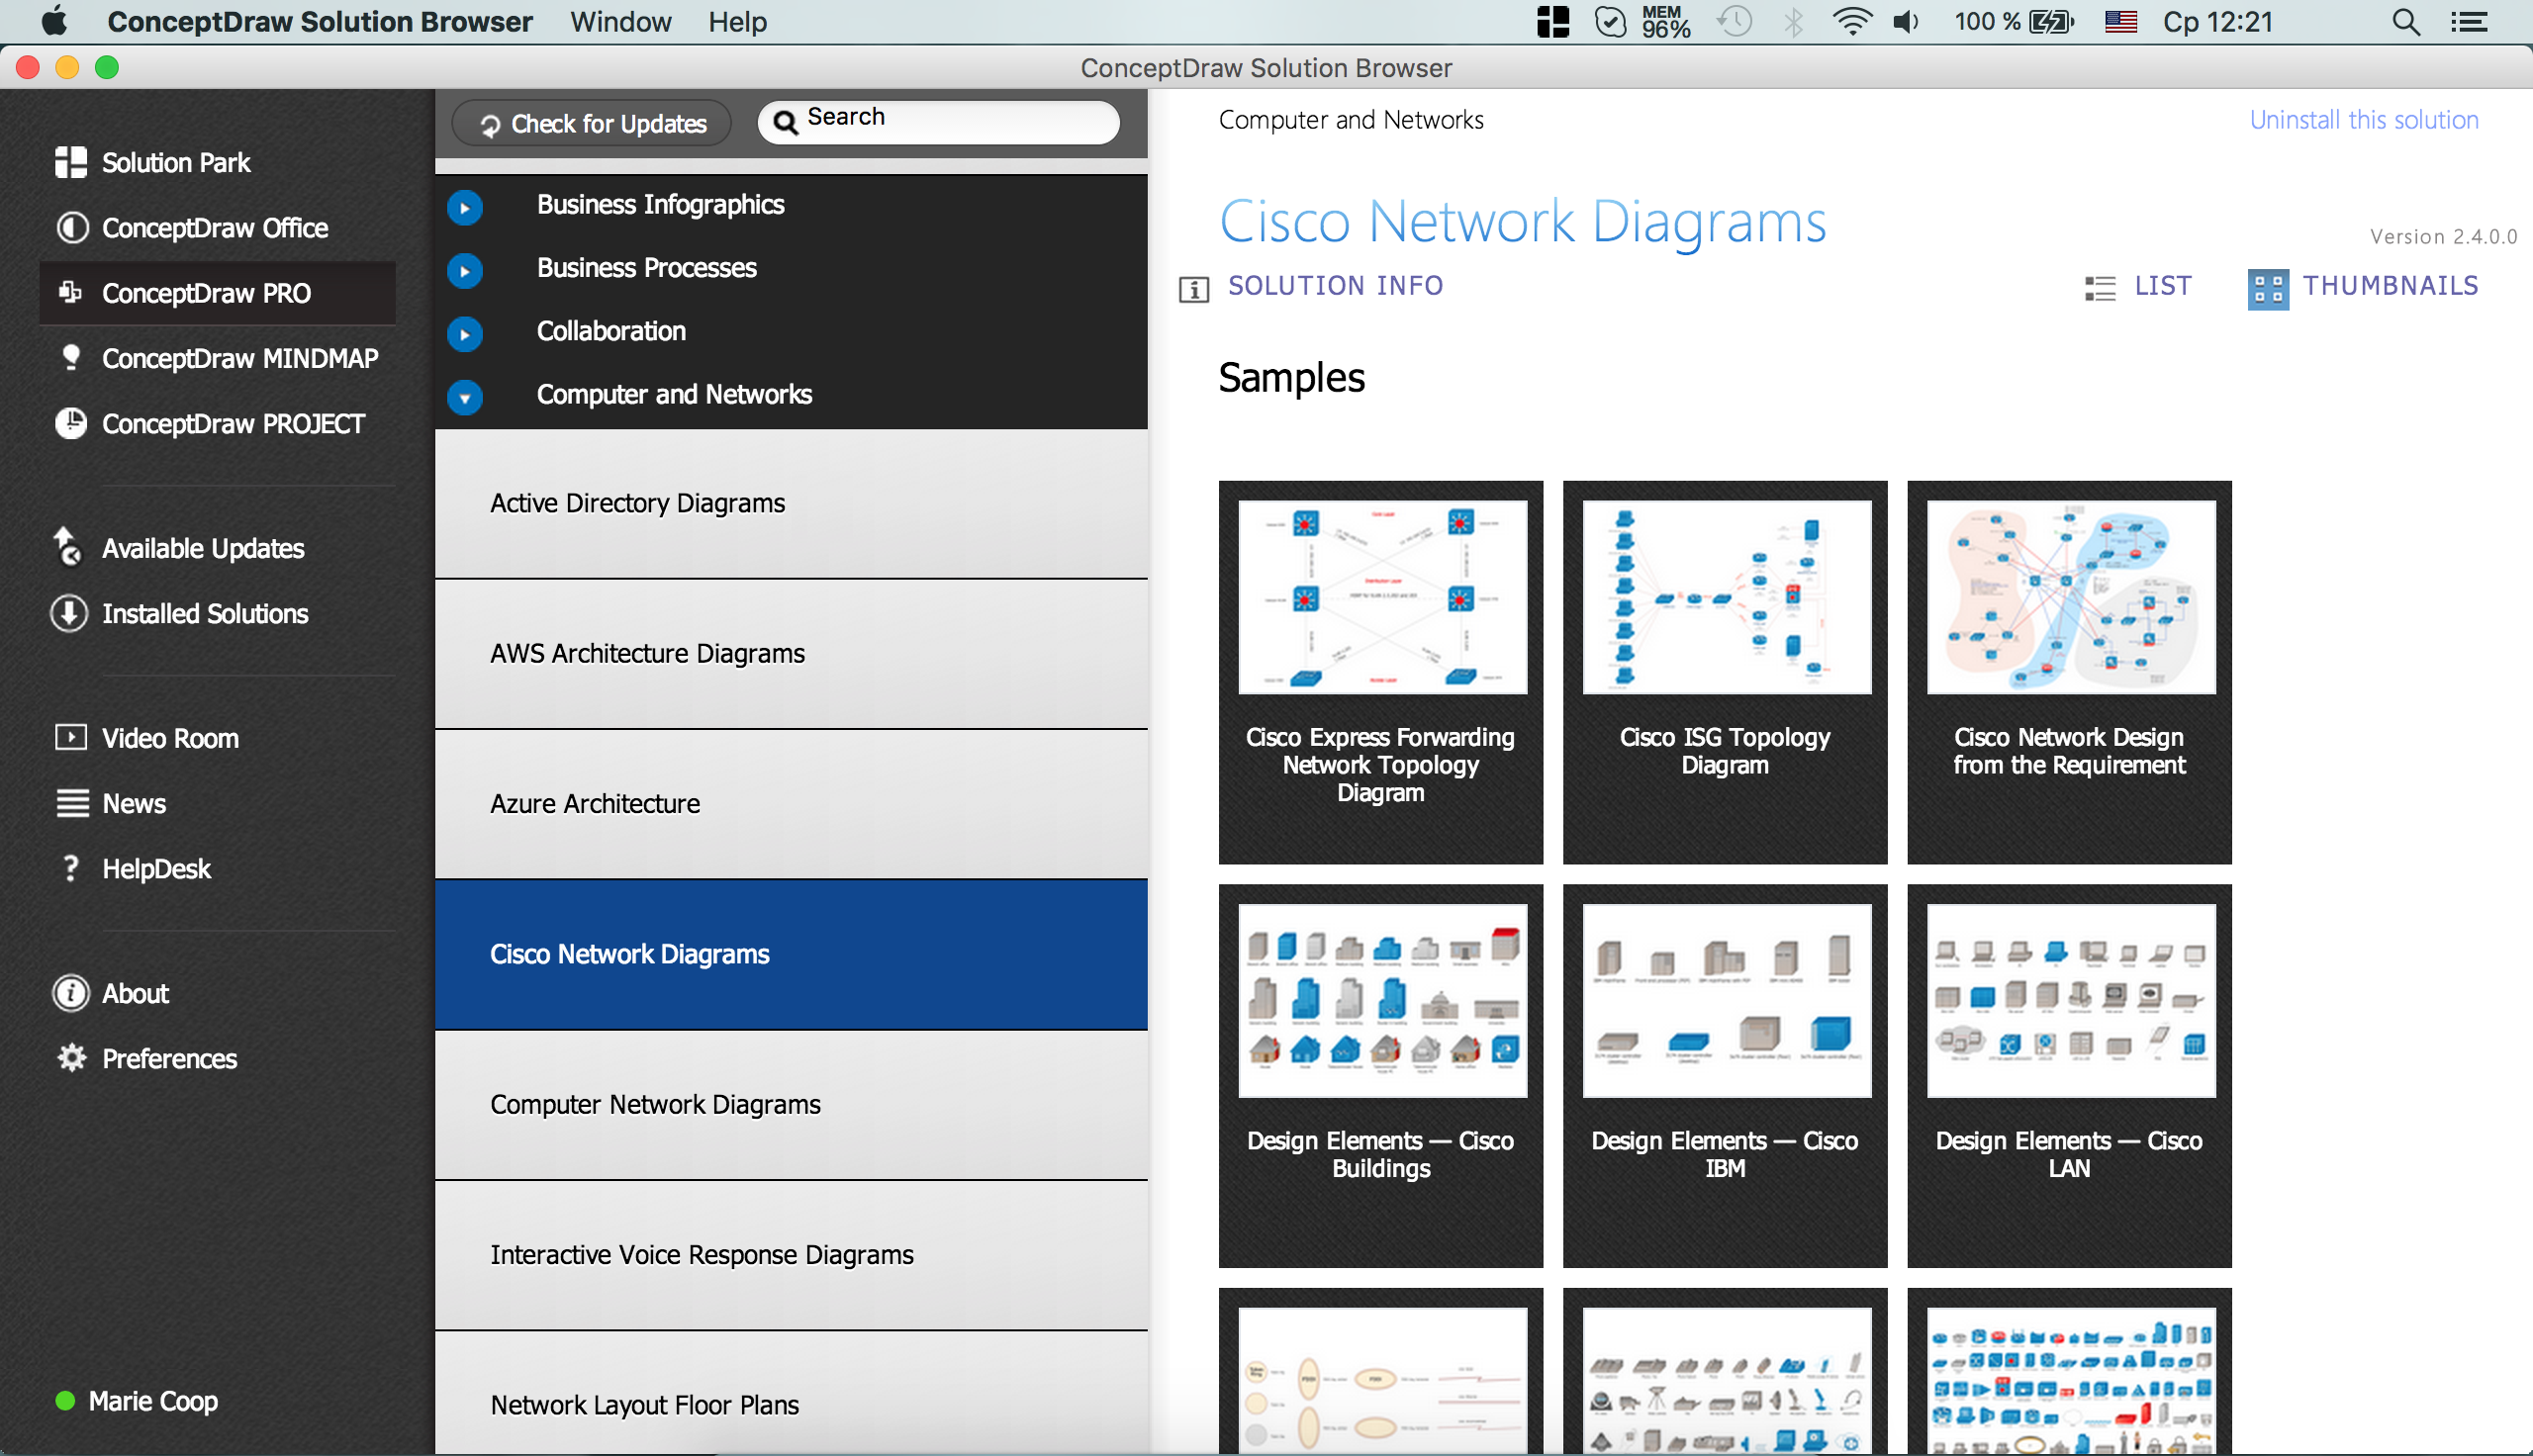
ConceptDraw makes the entire process of network visualization easier thanks to the numerous ready-to-use objects included in the package for presentation of network equipment, LDAP directory symbols and many other objects that symbolize resources in most various representations.
 Project Management Area
Project Management area provides Toolbox solutions to support solving issues related to planning, tracking, milestones, events, resource usage, and other typical project management functions.
 Social Media Response
This solution extends ConceptDraw PRO and ConceptDraw MINDMAP with the ability to draw interactive flow charts with action mind map templates, to help create an effective response to applicable social media mentions.
 What is a Dashboard Area
Solutions from the area What is a Dashboard of ConceptDraw Solution Park collects templates, samples and vector stencils libraries with of data driven charts and indicators for drawing the basic types of Visual Dashboards.
- Roaming wireless local area network diagram
- Network Diagram Examples | Network Diagram Software | Wireless ...
- Swot Analysis Examples for Mac OSX | SWOT analysis matrix ...
- Network Architecture | Mobile TV network diagram | Satellite network ...
- Telecommunication Network Diagrams | Design Elements ...
- Venn diagram - Internet marketing professions | Satellite network ...
- Satellite network diagram | Network diagrams with ConceptDraw ...
- Entity-Relationship Diagram
- Management | PM Teams | ConceptDraw PRO The best Business ...
- Cisco Network Templates | ConceptDraw PRO - Organizational ...
- Swot Analysis Examples for Mac OSX | Ansoff product market ...
- Network diagrams with ConceptDraw PRO | Computer and Networks
- Communication network diagram
- What is SWOT Analysis in Marketing | Positioning map (Perceptual ...
- Positioning map (Perceptual map) | Ansoff product market ...
- Network diagrams with ConceptDraw PRO | ConceptDraw PRO ...
- PM Agile | Business Processes description with ConceptDraw PRO ...
- Cross-Functional Flowcharts | Business Processes | PM Docs |
- Marketing | What is SWOT Analysis? | Swot Analysis Strengths ...
- GPS operation diagram | Local area network (LAN) diargam ...
