SWOT Analysis

This SWOT matrix diagram example was created on the base of article "An Easy Way To Jumpstart Your Strategic Plan: SWOT" by Leslie Wolf from the website of the California Digital Library, the University of California. "Strategic planning doesn’t have to be a daunting and lengthy process. The goal is really a simple one: to help you understand your world and build a road map to guide your efforts. ...
This analysis tool can help you focus your attention on the specific success factors that are right for your team.
The tool is called a SWOT analysis. SWOT stands for Strengths and Weaknesses, Opportunities and Threats. Here’s what it means:
(1) Strengths are those positive internal attributes that strengthen your business or team. You can develop plans to capitalize on those strengths.
(2) Weaknesses are those negative internal attributes that are working against your success. You can shore up those weaknesses so they don’t stop your success.
(3) Opportunities are those external conditions that can have a positive effect on your goals. These opportunities can point you in the right direction.
(4) Threats are those external conditions that can have a negative effect on your goals. These threats will affect you less if you can identify and minimize them. ...
We thought it would be helpful to show you a sample SWOT analysis for a business you can easily visualize: a small independent bookstore in a university town. The store owner brought the team together to think about how the bookstore could survive during the continuing financial downturn. After an hour of brainstorming, this is the SWOT analysis they developed." [cdlib.org/ cdlinfo/ 2010/ 09/ 29/ an-easy-way-to-jumpstart-your-strategic-plan-swot/ ]
The matrix diagram example "SWOT analysis for a small independent bookstore" was created using the ConceptDraw PRO diagramming and vector drawing software extended with the SWOT Analysis solution from the Management area of ConceptDraw Solution Park.
SWOT matrix

PERT Chart Software

Growth-Share Matrix Software

Prioritization Matrix

How to Create a PowerPoint Presentation from a SWOT Analysis Mindmap

Timeline Diagrams

VSM

SWOT matrix template

Swot Analysis Examples for Mac OSX

ConceptDraw DIAGRAM Comparison with Omnigraffle Professional and MS Visio

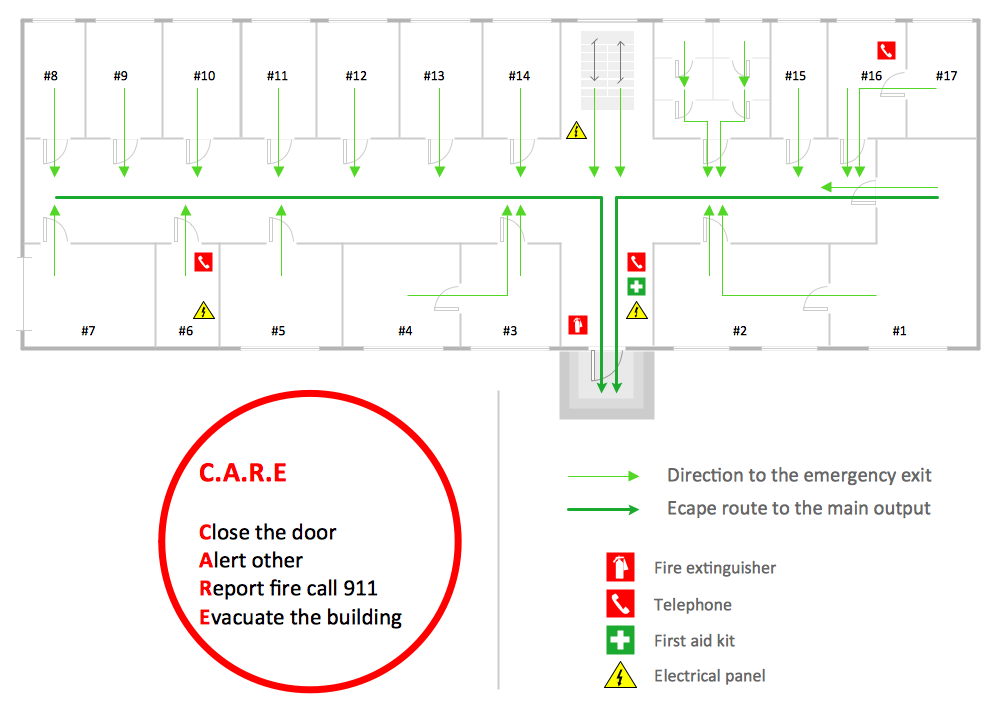
Fire Exit Plan
Winter Sports Vector Clipart. Medal Map. Spatial Infographics

 Event-driven Process Chain Diagrams
Event-Driven Process Chain Diagrams solution extends ConceptDraw DIAGRAM functionality with event driven process chain templates, samples of EPC engineering and modeling the business processes, and a vector shape library for drawing the EPC diagrams and EPC flowcharts of any complexity. It is one of EPC IT solutions that assist the marketing experts, business specialists, engineers, educators and researchers in resources planning and improving the business processes using the EPC flowchart or EPC diagram. Use the EPC solutions tools to construct the chain of events and functions, to illustrate the structure of a business process control flow, to describe people and tasks for execution the business processes, to identify the inefficient businesses processes and measures required to make them efficient.
HR Management Software

- Swot Analysis For Event Planning Business
- Swot Analysis For Event Planning
- Swot Analysis Example Event Place
- SWOT Analysis | Growth-Share Matrix Software | Prioritization Matrix ...
- Critical Path Event Planning
- Extended Swot Analysis
- SWOT Analysis | SWOT Analysis | Small business consultancy ...
- Bar Diagrams for Problem Solving. Create event management bar ...
- Fishbone Diagrams | Fishbone Diagram Problem Solving | SWOT ...
- SWOT Analysis | Activity Network Diagram Method | Process ...
- SWOT Template | TOWS Analysis | TOWS Analysis Software | Swot ...
- SWOT Analysis | SWOT Matrix Template | SWOT analysis matrix ...
- Ansoff Matrix | Matrices | Competitor Analysis | Market Growth Example
- Event Planning Process
- Conference Planning Software | Conference Planning | Presenting a ...
- SWOT Analysis | Gant Chart in Project Management | SWOT ...
- Root cause analysis tree diagram - Manufacturing problem solution ...
- Cause and Effect Analysis - Fishbone Diagrams for Problem Solving ...
- Venn Diagram Examples for Problem Solving. Computer Science ...
- SWOT analysis for a small independent bookstore | How To use ...