Process Flowchart


Electrical Symbols, Electrical Diagram Symbols

 Computer Network Diagrams
Computer Network Diagrams solution extends ConceptDraw PRO software with samples, templates and libraries of vector icons and objects of computer network devices and network components to help you create professional-looking Computer Network Diagrams, to plan simple home networks and complex computer network configurations for large buildings, to represent their schemes in a comprehensible graphical view, to document computer networks configurations, to depict the interactions between network's components, the used protocols and topologies, to represent physical and logical network structures, to compare visually different topologies and to depict their combinations, to represent in details the network structure with help of schemes, to study and analyze the network configurations, to communicate effectively to engineers, stakeholders and end-users, to track network working and troubleshoot, if necessary.
The vector clipart library "Presentation design elements" contains 45 presentation symbols and arrows which you can easy use in your slides and illustrations.
"A presentation is the process of presenting a topic to an audience. It is typically a demonstration, lecture, or speech meant to inform, persuade, or build good will. ... the use of visuals reduced meeting times... audiences believe presenters who use visuals are more professional and credible than presenters who merely speak. ... meetings and presentations reinforced with visuals help participants reach decisions and consensus more quickly." [Presentation. Wikipedia]
The clip art example "Presentation design elements - Vector clipart library" was created in the ConceptDraw PRO diagramming and vector drawing software using the Presentation Clipart solution from the Illustration area of ConceptDraw Solution Park.
Advance Direction Sign

Circuit

Growth

Master Link

Comparison

Plus

Minus

Multiplication

Division

Loupe

Plus sign

Minus sign

Pros and Cons

Balance Lever

Balance

Scientific Research

Business People

Hand

Financial Growth

Wallet

Increase

Decrease

Clock

Mechanism

Interaction

Small Company

Big Company

Company Expansion

Foreign Market Entry

Time

Close Cooperation

Company

Company Merger

Company Extension

Foreign Market Penetration

Business Relations

Profits

Frame 1

Frame 2

Background 1

Background 2

Background 3

Background 4

Background 5

Title block

UML Class Diagram Example - Apartment Plan

Building Drawing Design Element: Plumbing


 Flowcharts
The Flowcharts solution for ConceptDraw PRO is a comprehensive set of examples and samples in several varied color themes for professionals that need to represent graphically a process. Solution value is added by the basic flow chart template and shapes' libraries of flowchart notation. ConceptDraw PRO flow chart creator lets one depict the processes of any complexity and length, as well as design the Flowchart either vertically or horizontally.
Affinity Diagram

Network Glossary Definition


 Azure Architecture
Azure Architecture solution bundles into one handy tool everything you need to create effective Azure Architecture diagrams. It adds the extra value to versatile ConceptDraw PRO software and extends the users capabilities with comprehensive collection of Microsoft Azure themed graphics, logos, preset templates, wide array of predesigned vector symbols that covers the subjects such as Azure management, Azure storage, and Azure services, amongst others, and allow you to illustrate Azure Architecture diagrams at any degree of complexity, to present visually your Azure cloud system architecture with professional style, to design Azure cloud topology, to document Windows Azure Architecture and Azure Cloud System Architecture, to visualize the great abilities and work of Microsoft Azure Cloud System and Azure services.
Process Flow Chart

Circuits and Logic Diagram Software

 Seven Management and Planning Tools
Seven Management and Planning Tools solution extends ConceptDraw PRO and ConceptDraw MINDMAP with features, templates, samples and libraries of vector stencils for drawing management mind maps and diagrams.
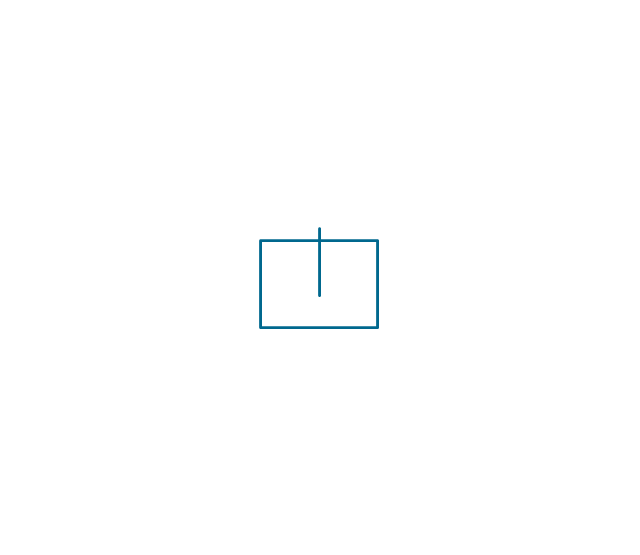
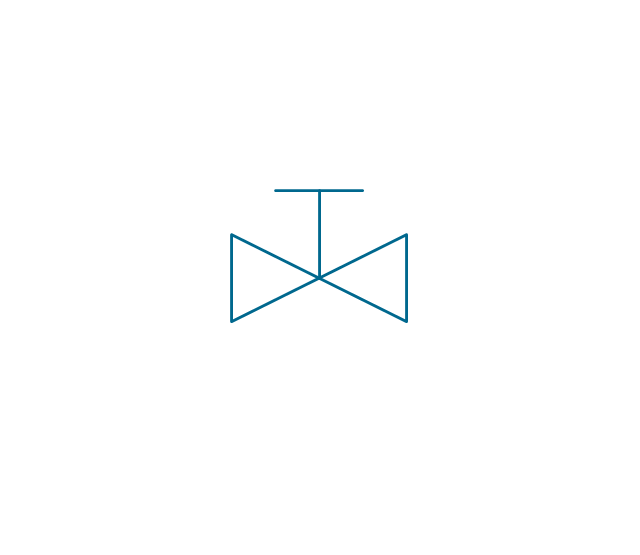
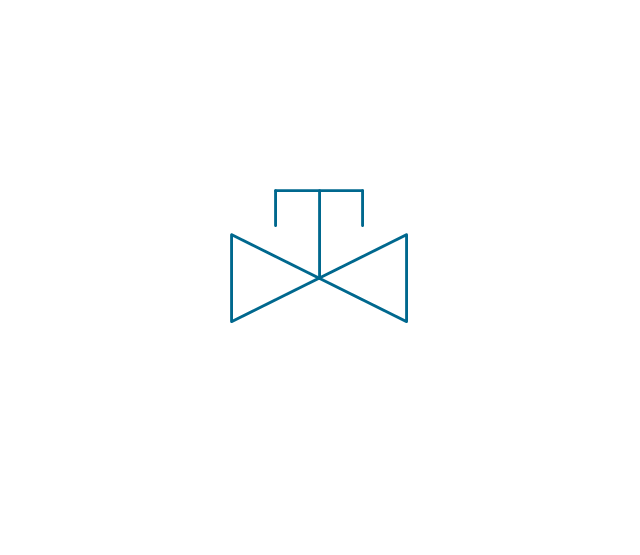
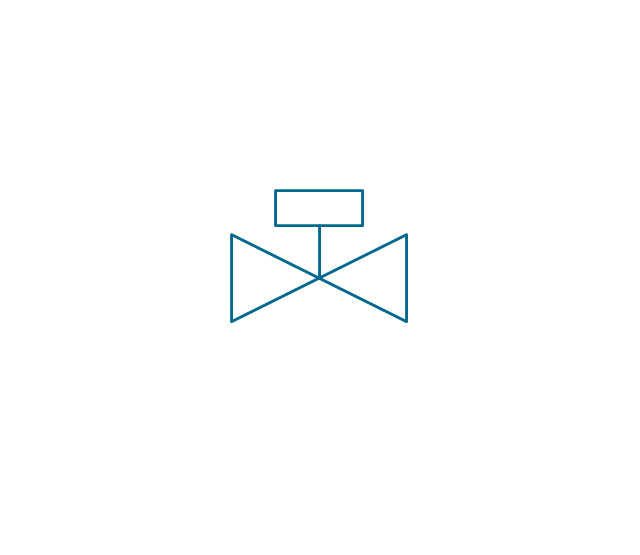
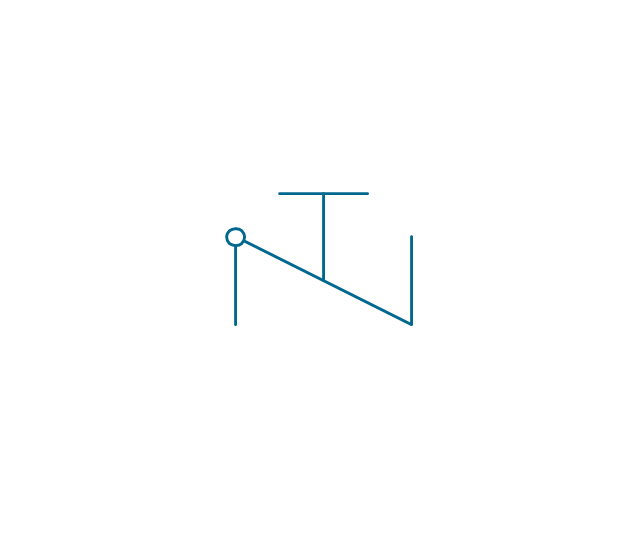
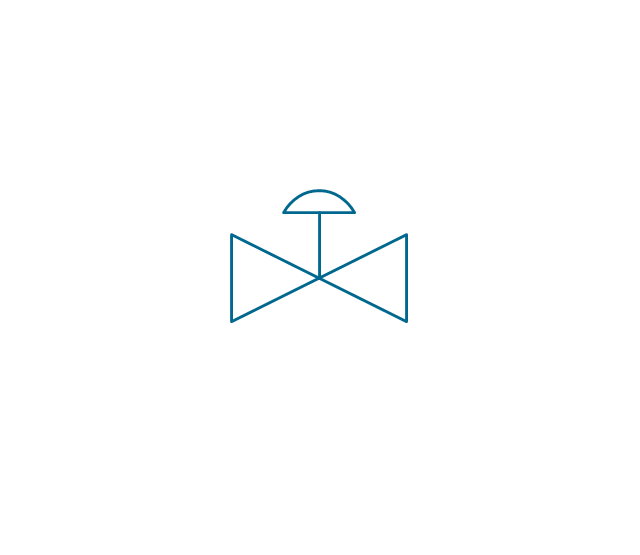
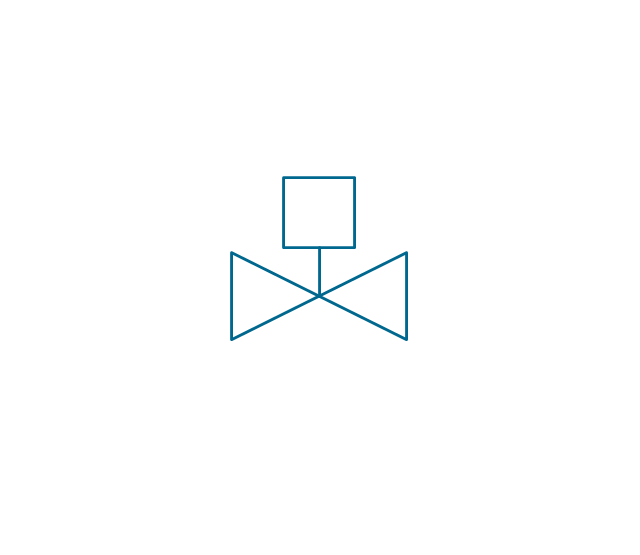
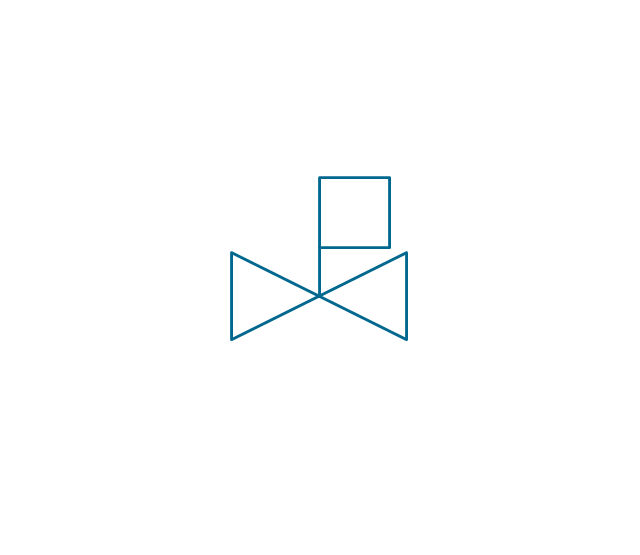
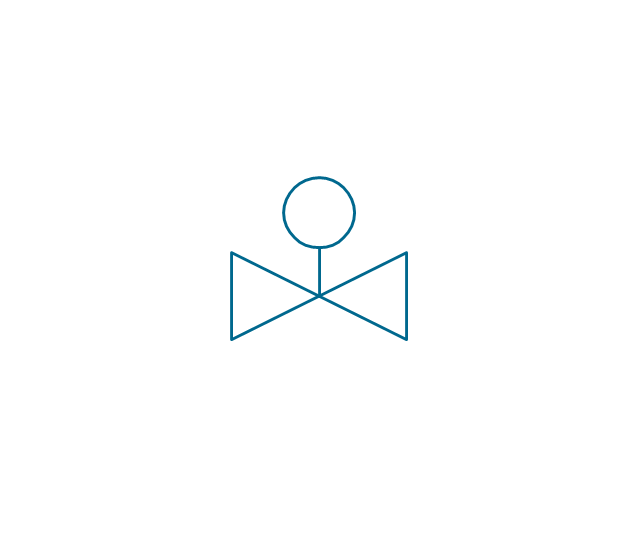
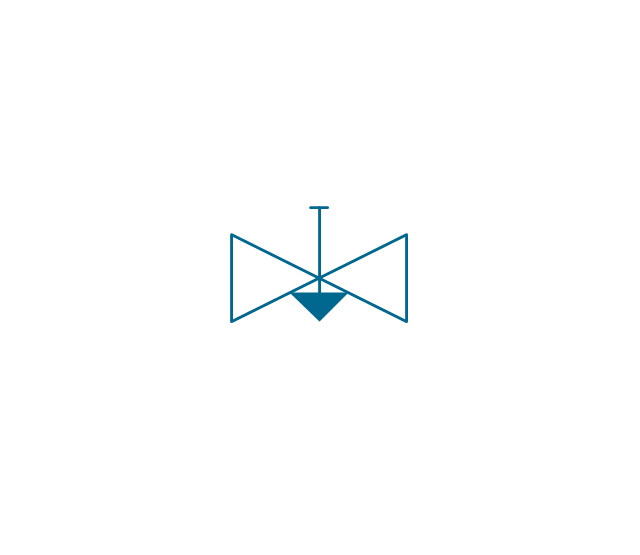
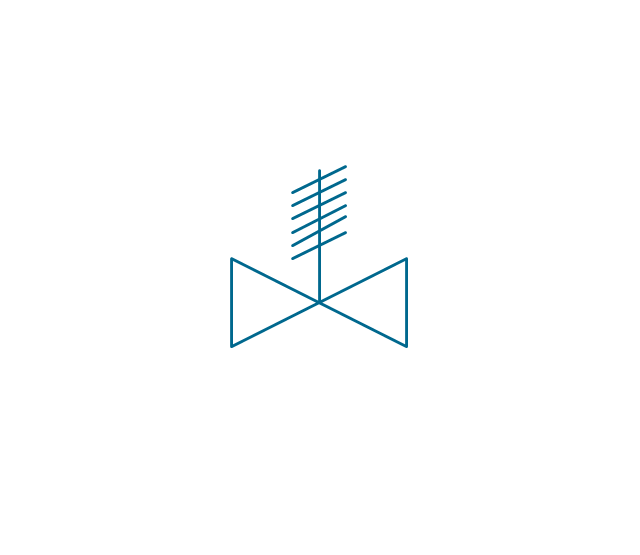
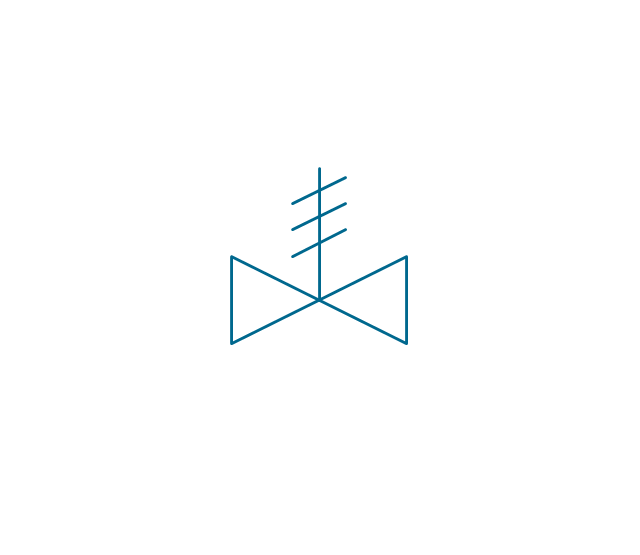
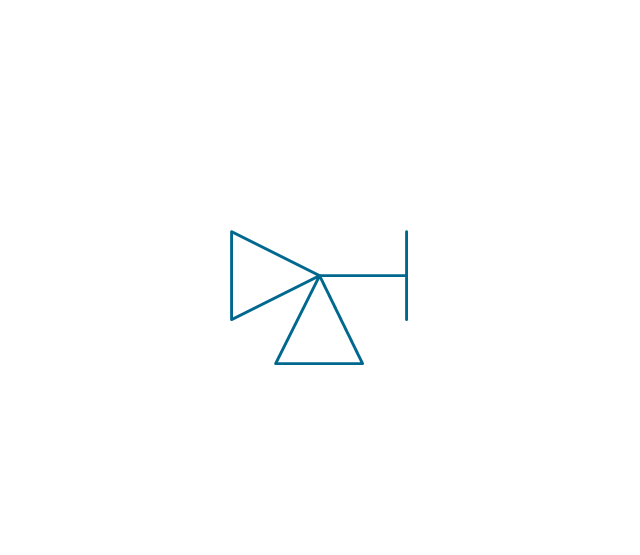
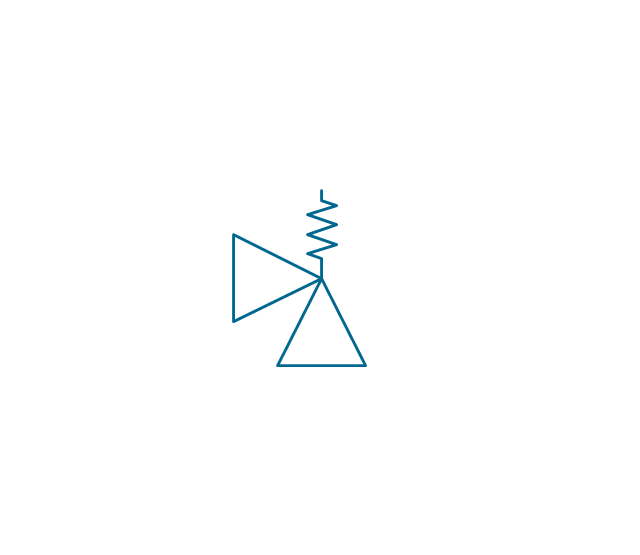
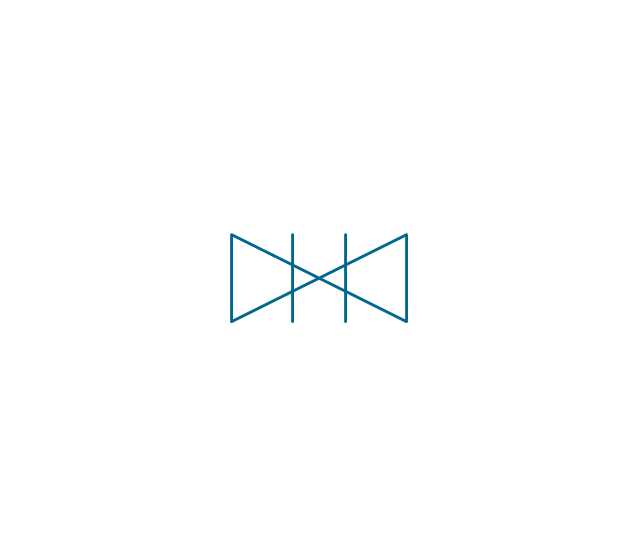
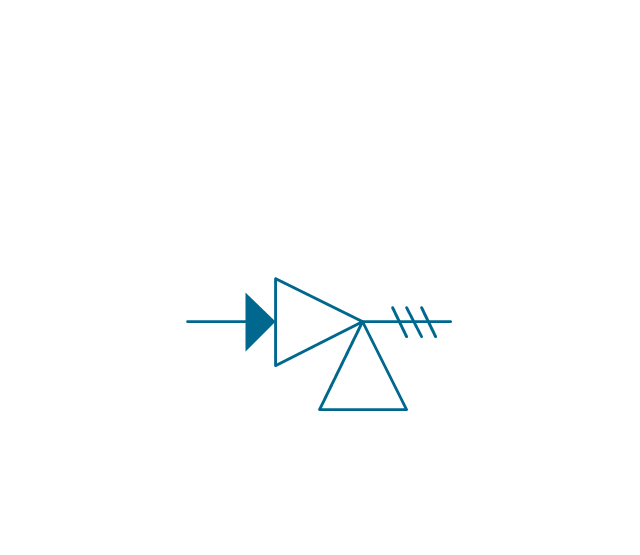
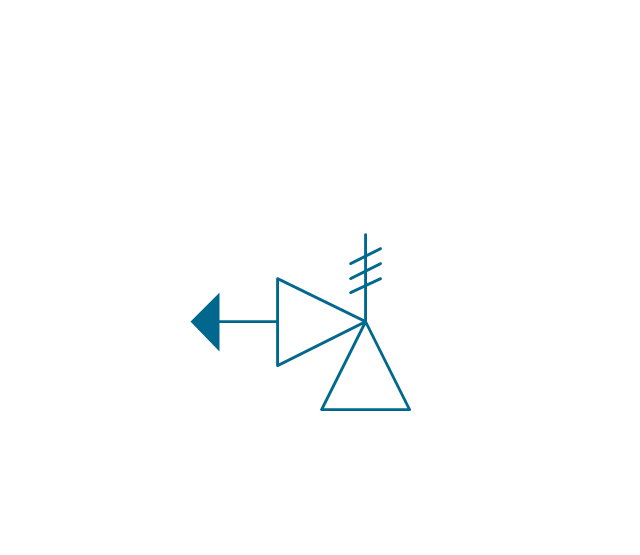
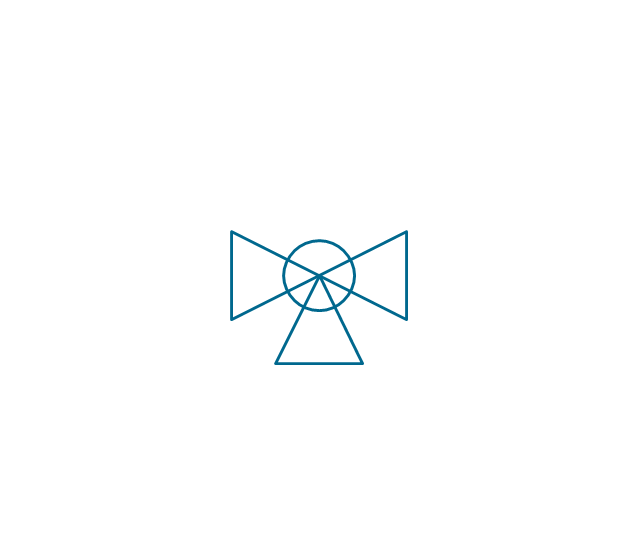
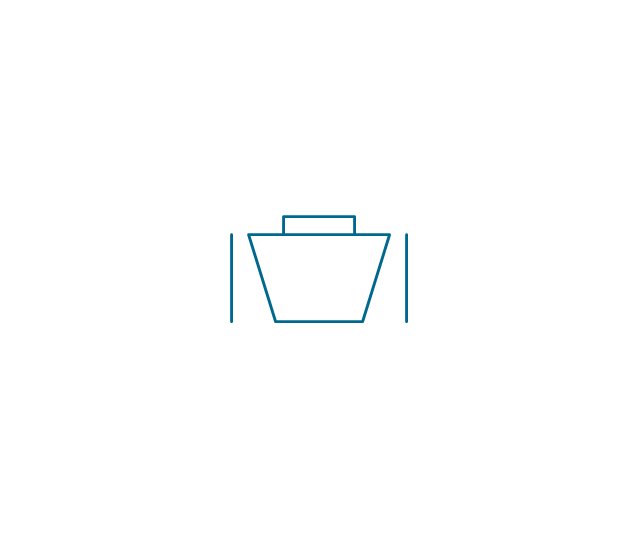
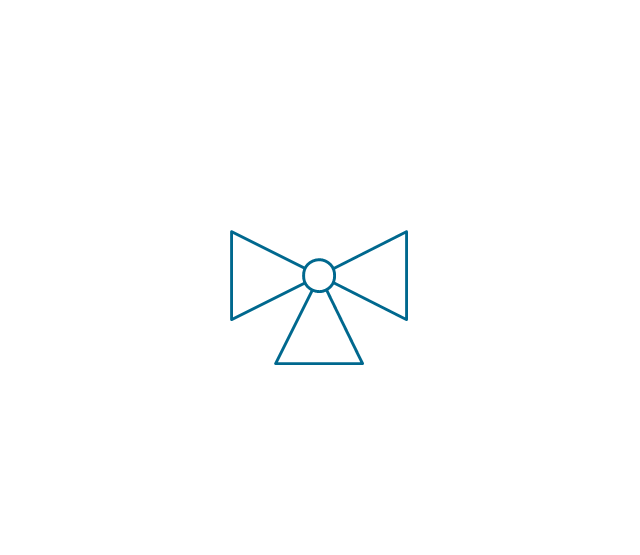
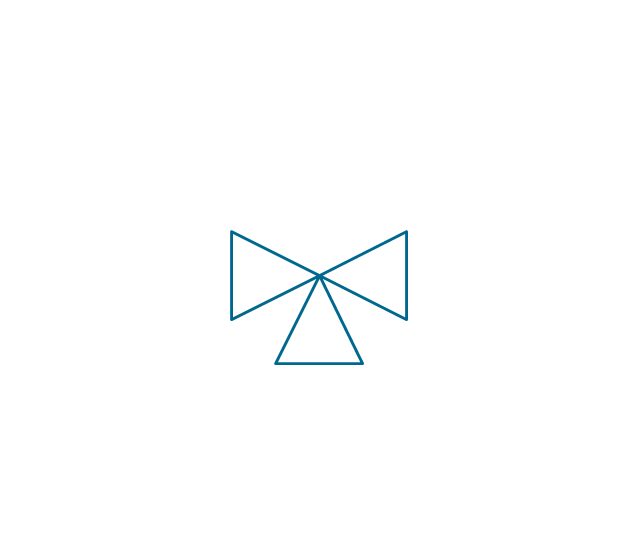
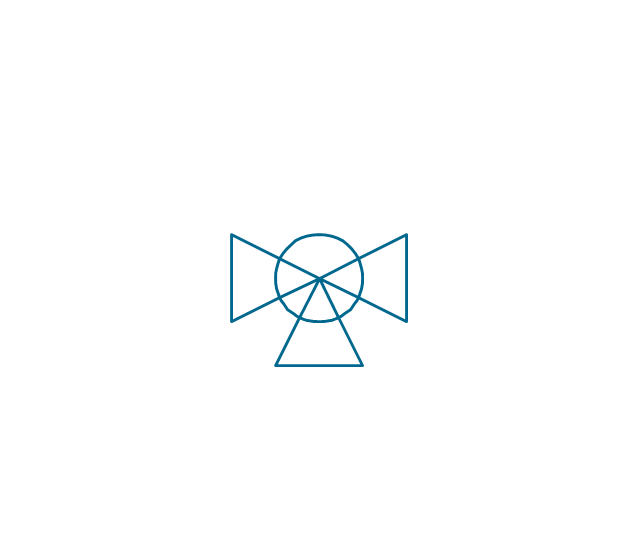
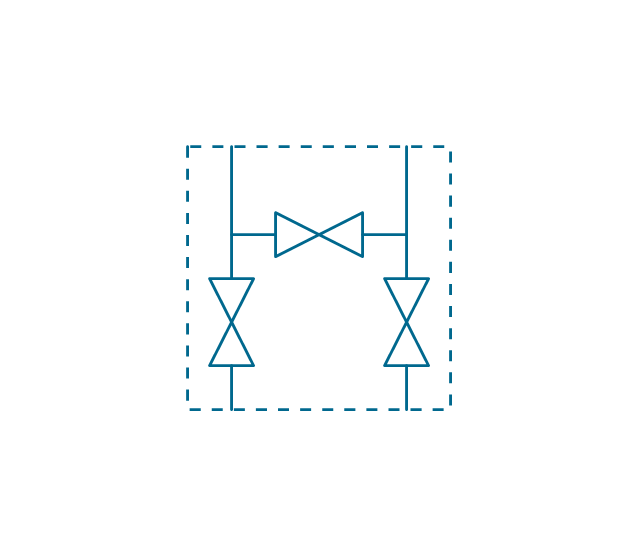
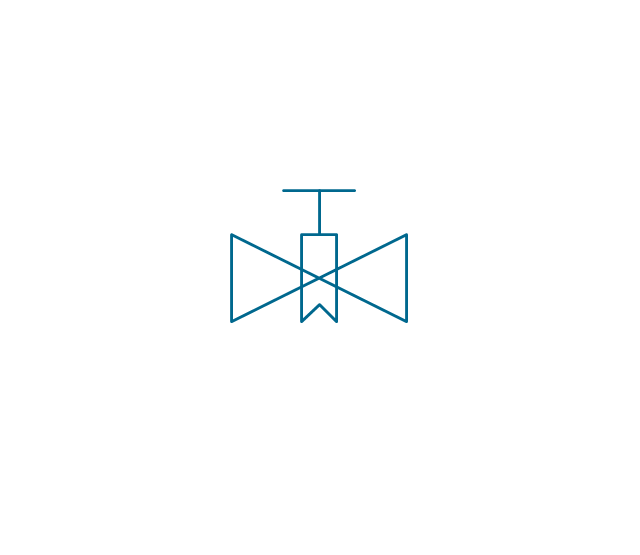
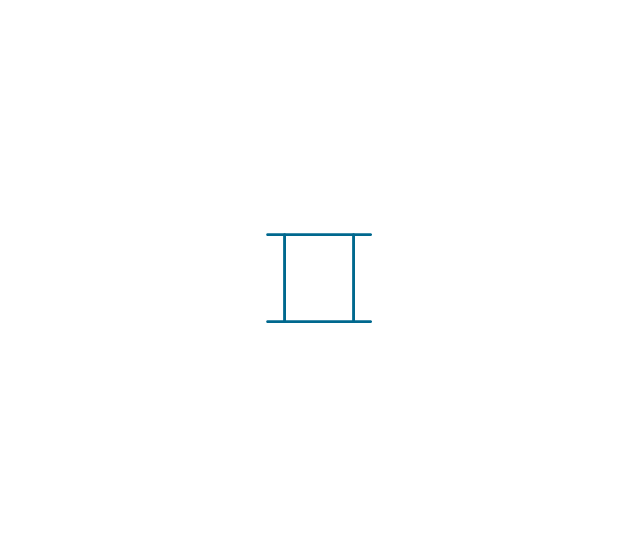
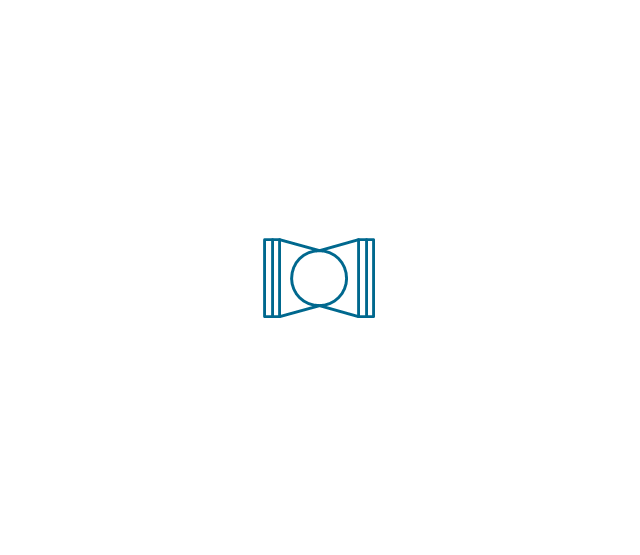
The vector stencils library "Valves and fittings" contains 104 symbols of valve components.
Use these icons for drawing industrial piping systems; process, vacuum, and fluids piping; hydraulics piping; air and gas piping; materials distribution; and liquid transfer systems in the ConceptDraw PRO software extended with the Chemical and Process Engineering solution from the Chemical and Process Engineering area of ConceptDraw Solution Park.
www.conceptdraw.com/ solution-park/ engineering-chemical-process
Electrically bonded

Bursting disc
Flame arrester

Strainer
Separator

Exhaust silencer
Bell mouth

Exhaust head

Hydrant

Drain silencer
Liquid seal open/closed
Y strainer

Gate valve

Globe valve

Globe valve 2

Globe valve 3

Screw-down valve
Lock-shield valve
Reel valve
Check valve

Check valve 2
Check valve 3

Screw-down check valve

Stop check valve
Diaphragm valve
Diaphragm valve 2

Diaphragm valve 3

Powered valve
Powered valve 2
Powered valve 3
Needle valve

Needle valve 2
Needle valve 3

Relief valve

Relief valve 2
Relief valve 3
Angle valve

Angle valve 2

Angle valve 3
Angle valve 4
Float operated valve

Float operated valve 2

Flanged valve

Butterfly valve

Butterfly valve 2

Wedge gate valve

Parallel slide valve
Ball valve

Ball valve 2

Ball valve 3

Relief angle valve vacuum
Relief angle valve pressure
Reducing valve

Reducing valve 2

Plug valve 3 way
Plug valve L point

Plug valve 2

Plug valve
Plug valve straight through

Plug valve T point

3-way plug valve

3-way plug valve 2
3-way plug valve 3
Mixing valve
Valve Manifold
Characterized port valve
Reducer

Reducer 2

General joint

Butt weld

Butt weld 2

Butt weld 3

Butt weld 4

Flanged/ bolted

Soldered / solvent

Soldered / solvent 2

Screwed joint

Screwed joint 2

Screwed joint 3

Socket and spigot

Socket and spigot 2

Socket and spigot 3

Sleeve

Sleeve 2

Screwed sleeve

Screwed sleeve 2

Socket weld
Socket weld 2

Swivel joint

Swivel joint 2
Swivel joint 3

End cap

End cap butt welded

End cap screwed

End cap socket and spigot

End cap fillet welded

End cap screwed and plugged

End cap quick release

End cap flanged and bolted

End cap flanged and bolted 2

Electrically insulated

Tundish

Syphon drain

Open vent

 Venn Diagrams
Venn Diagrams are actively used to illustrate simple set relationships in set theory and probability theory, logic and statistics, mathematics and computer science, linguistics, sociology, and marketing. Venn Diagrams are also often used to visually summarize the status and future viability of a project.
- SysML | UML Notation | Extension Mechanism Icon Png
- SysML Diagram | Cisco People. Cisco icons , shapes, stencils and ...
- Png Background Designs
- Time For Expansion Clip Art Png
- Economic Growth Vector Png
- Grey Extension Arrow
- Growth Png Clipart
- Collapse Symbol Png
- Joint Arrow Icon Png
- Meeting Cartoon Png
- Business Growth Icon Png Black
- App icons - Vector stencils library | Business feedback loop | Time ...
- Expand Collapse Icon Png
- Cisco People. Cisco icons , shapes, stencils and symbols | Design ...
- Medical Equipment Icon Vector Png
- Background Vector Png
- Meeting Vector Icon Png
- Png Rectangle Designs
- People Elements Png
- 4 Elements Png