Brilliant Examples of Infographics Map, Transport, Road

 Aerospace and Transport
This solution extends ConceptDraw PRO software with templates, samples and library of vector clipart for drawing the Aerospace and Transport Illustrations. It contains clipart of aerospace objects and transportation vehicles, office buildings and anci
 Maps
Maps
This solution extends ConceptDraw PRO v9.4 with the specific tools necessary to help you draw continental, directional, road, or transit maps, to represent international, business, or professional information visually.
Transportation Infographics

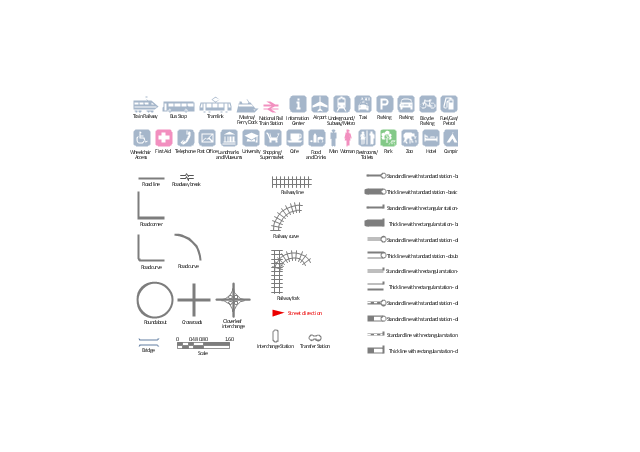
The vector stencils library "Transport map" contains 96 signs and pictograms for drawing road and transit maps.
"A transit map is a topological map in the form of a schematic diagram used to illustrate the routes and stations within a public transport system - whether this be bus lines, tramways, rapid transit, commuter rail or ferry routes. The main components are color coded lines to indicate each line or service, with named icons to indicate stations or stops.
Transit maps can be found in the transit vehicles, at the platforms or in printed timetables. Their primary function is to help users to efficiently use the public transport system, including which stations function as interchange between lines. Unlike conventional maps, transit maps are usually not geographically accurate - instead they use straight lines and fixed angles, and often illustrate a fixed distance between stations, compressing those in the outer area of the system and expanding those close to the center." [Transit map. Wikipedia]
The pictograms example "Design elements - Transport map" was created using the ConceptDraw PRO diagramming and vector drawing software extended with the Spatial Infographics solution from the Maps area of ConceptDraw Solution Park.
Transport map pictograms
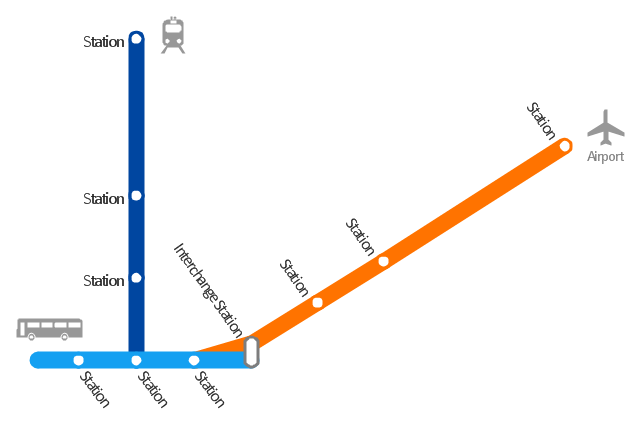
"A transit map is a topological map in the form of a schematic diagram used to illustrate the routes and stations within a public transport system - whether this be bus lines, tramways, rapid transit, commuter rail or ferry routes. The main components are color coded lines to indicate each line or service, with named icons to indicate stations or stops. ...
There are a growing number of books, websites and works of art on the subject of urban rail and metro map design and use. There are now hundreds of examples of diagrams in an urban rail or metro map style that are used to represent everything from other transit networks like buses and national rail services to sewerage systems and Derbyshire public houses." [Transit map. Wikipedia]
The transportation map template for the ConceptDraw PRO diagramming and vector drawing software is included in the Spatial Infographics solution from the area "What is Infographics" of ConceptDraw Solution Park.
Transit map
 Vehicular Networking
Vehicular Networking solution extends ConceptDraw PRO software with templates, samples and libraries of vector stencils for drawing the vehicular computer communication network diagrams and schemes.
This flowchart example was created on the base of land sales process diagram from the Property management webpage of the VicRoads website.
[www.vicroads.vic.gov.au/ planning-and-projects/ property-services/ property-management]
"VicRoads or the Roads Corporation of Victoria is a statutory corporation which is the state road and traffic authority in the state of Victoria, Australia. It is responsible for maintenance and construction of the state arterial road network, as well as driver licensing and vehicle registration. VicRoads has broad responsibility for road safety policy and research. It is also responsible for regulating the accident towing industry in Victoria." [VicRoads. Wikipedia]
"Sales Process.
Once it has been established with the relevant VicRoads Regions/ Projects and other business areas that properties are identified as surplus to VicRoads’ operational needs, they are incorporated in the VicRoads annual sales program.
Following approval: relevant VicRoads Regional Manager and the VicRoads Chief Executive (and in some circumstances Minster for Public Transport and Roads) must approve all land deemed surplus and available for disposal.
The method of sale is then determined and consultant advice is sought:
(1) Planning.
(2) Valuer General Victoria (Valuer General’s office must provide a valuation for all sales).
(3) Government Land Monitor (Land Monitor approval is sought if the value exceeds $750,000).
(4) Environmental.
(5) Local Council." [www.vicroads.vic.gov.au/ planning-and-projects/ property-services/ property-management]
The example "Land sales process flowchart" was created using the ConceptDraw PRO diagramming and vector drawing software extended with the Sales Flowcharts solution from the Marketing area of ConceptDraw Solution Park.
Sales process chart

Best Tool for Infographic Construction

 Directional Maps
Directional Maps solution extends ConceptDraw PRO software with templates, samples and libraries of vector stencils for drawing the directional, location, site, transit, road and route maps, plans and schemes.
 Site Plans
Vivid and enticing plan is the starting point in landscape design and site plan design, it reflects the main design idea and gives instantly a vision of the end result after implementation of this plan. Moreover site plan, architectural plan, detailed engineering documents and landscape sketches are obligatory when designing large projects of single and multi-floor buildings.
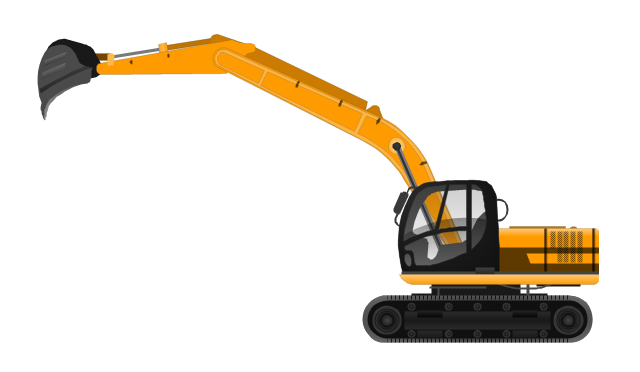
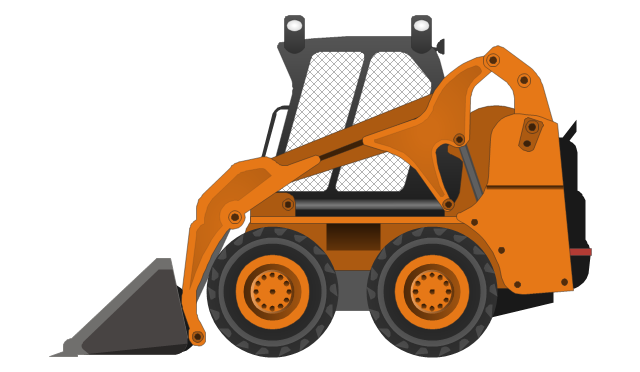
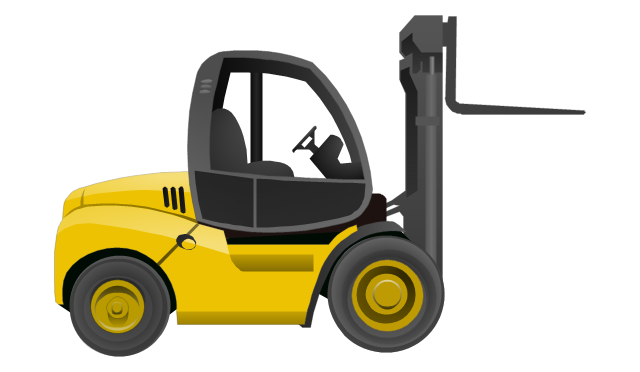
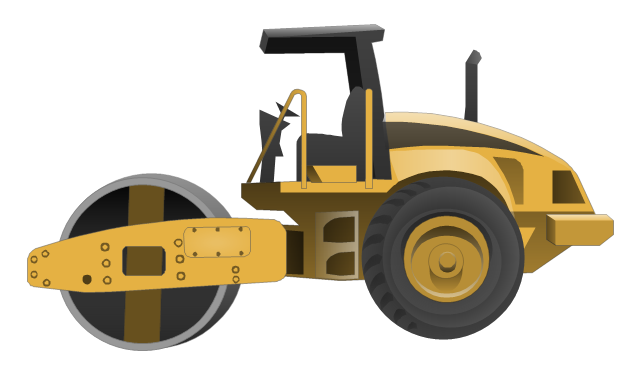
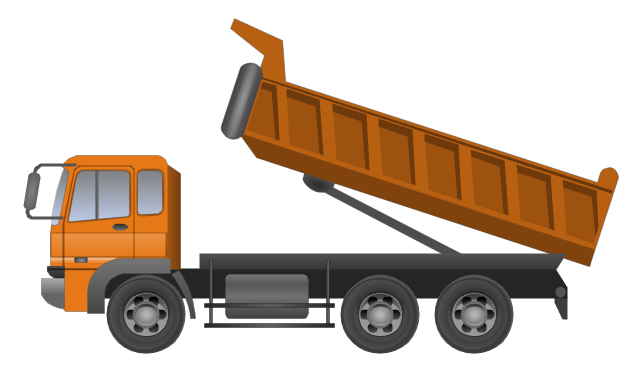
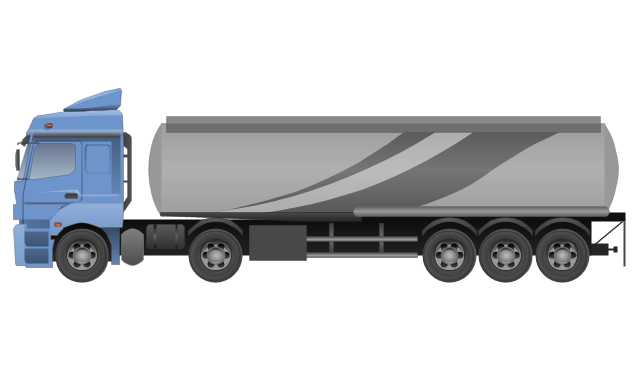
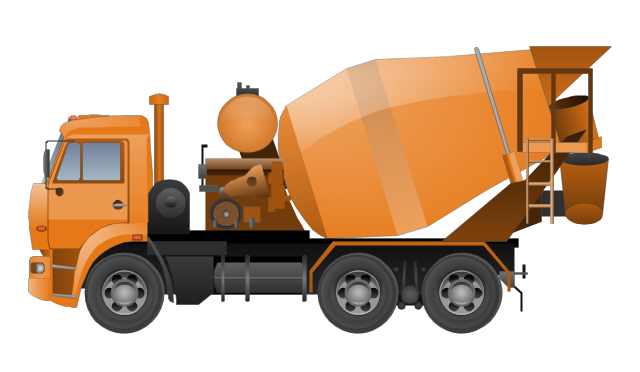
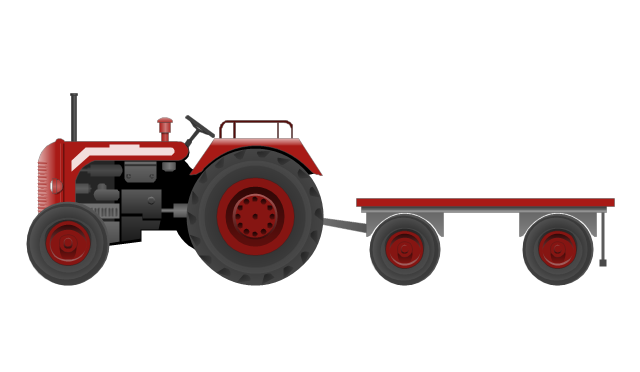
The vector stencils library "Industrial vehicles" contains 14 clipart images of industrial and building vehicles for drawing illustrations.
"A truck (US, CA, AU, NZ) or lorry (UK and Ireland) is a motor vehicle designed to transport cargo. Trucks vary greatly in size, power, and configuration, with the smallest being mechanically similar to an automobile. Commercial trucks can be very large and powerful, and may be configured to mount specialized equipment, such as in the case of fire trucks and concrete mixers and suction excavators. Modern trucks are largely powered by diesel engines exclusively, although small to medium size trucks with gasoline engines exist in America. In the European Union vehicles with a gross combination mass of less than 3,500 kilograms (7,716 lb) are known as light commercial vehicles and those over as large goods vehicles." [Truck. Wikipedia]
The clip art example "Industrial vehicles - Vector stencils library" was created in the ConceptDraw PRO diagramming and vector drawing software using the Manufacturing and Maintenance solution from the Illustration area of ConceptDraw Solution Park.
Excavator
Bucket loader
Forklift truck
Road roller
Dumper truck
Tank truck
Concrete mixing transport truck
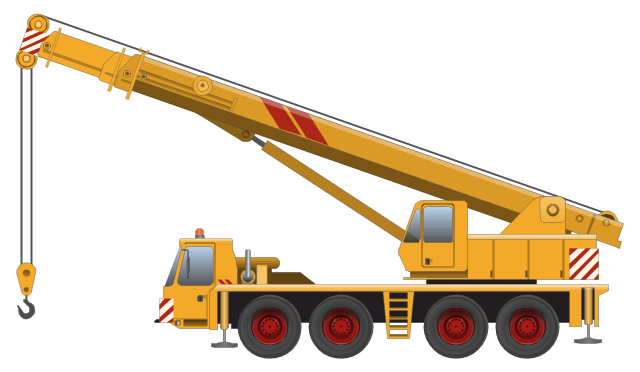
Truck-mounted crane
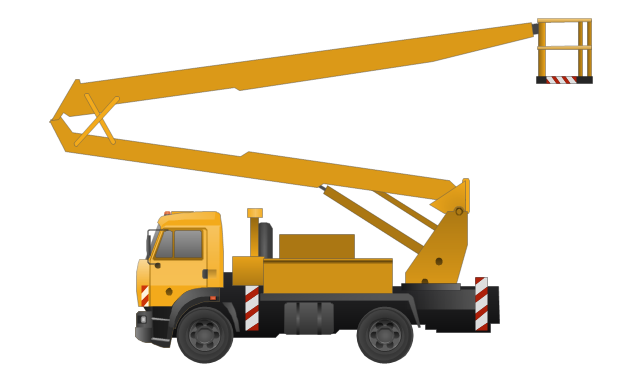
Aerial work platform
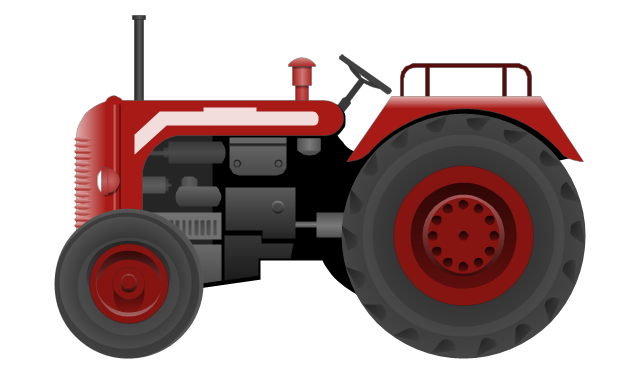
Tractor
Tractor with a trailer
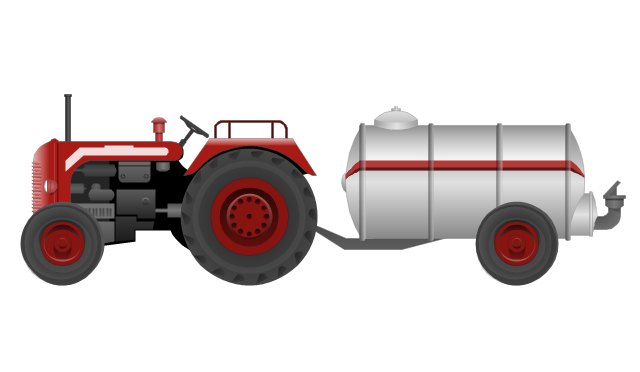
Tractor with a petrol tanker
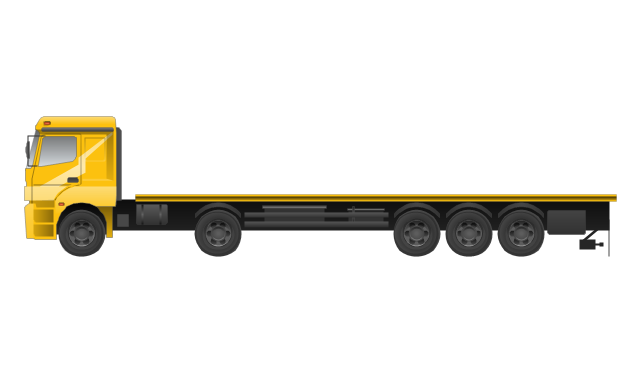
Full trailer truck
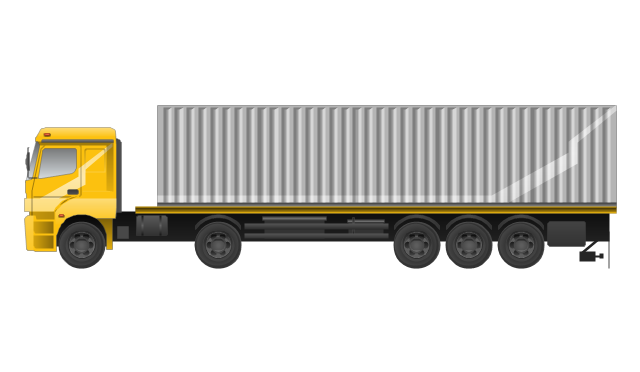
Trailer with container
 Spatial Infographics
Spatial infographics solution extends ConceptDraw PRO software with infographic samples, map templates and vector stencils libraries with design elements for drawing spatial information graphics.
Spatial infographics Design Elements: Location Map

Tools to Create Your Own Infographics

Map Infographic Design

Map Infographic Tool

Use the vector clipart library Funny transport to draw your own cartoon illustrations with images of vehicles for children's literature, boards and cards educational games for kids using the ConceptDraw PRO diagramming and vector drawing software.
"Children's literature or juvenile literature includes stories, books, and poems that are enjoyed by children." [Children's literature. Wikipedia] "Educational games are games explicitly designed with educational purposes, or which have incidental or secondary educational value. All types of games may be used in an educational environment. Educational games are games that are designed to teach people about certain subjects, expand concepts, reinforce development, understand an historical event or culture, or assist them in learning a skill as they play. Game types include board, card, and video games." [Educational game. Wikipedia]
The Transport - Vector illustration example was created using the Artwork solution from the Illustration area of ConceptDraw Solution Park.
Cartoon
Spatial Infographics

Visualization Spatial Data Using Thematic Maps Combined with Infographics

Nice and simple, but the features it have are power-packed!
- Road Transport - Design Elements | Brilliant Examples of ...
- Network Diagram Examples | Road Transport - Design Elements ...
- Aerospace and Transport | UML Class Diagram Example for ...
- Brilliant Examples of Infographics Map, Transport , Road | Maps ...
- Road Transport - Design Elements | Design elements - Road ...
- ER Diagrams with ConceptDraw PRO | Road Transport - Design ...
- Maps | Brilliant Examples of Infographics Map, Transport , Road | Site ...
- Road Transport - Design Elements | Business diagrams & Org ...
- Road Transport - Design Elements | Visio Look a Like Diagrams ...
- Road Transport - Design Elements | 3D Directional map template ...
- Presentation Clipart | Aerospace and Transport | Road Transport ...
- Road Transport - Design Elements | Aerospace and Transport ...
- Road Transport - Design Elements | Design elements - Road ...
- Brilliant Examples of Infographics Map, Transport , Road | Map ...
- Maps | Brilliant Examples of Infographics Map, Transport , Road ...
- Maps | Types of Map - Overview | Brilliant Examples of Infographics ...
- Road Transport - Design Elements | Design elements - Road ...
- Road Transport - Design Elements | Aerospace and Transport | Ring ...
- Aerospace and Transport | Road Transport - Design Elements ...
- Aerospace and Transport | Industrial transport - Design elements ...