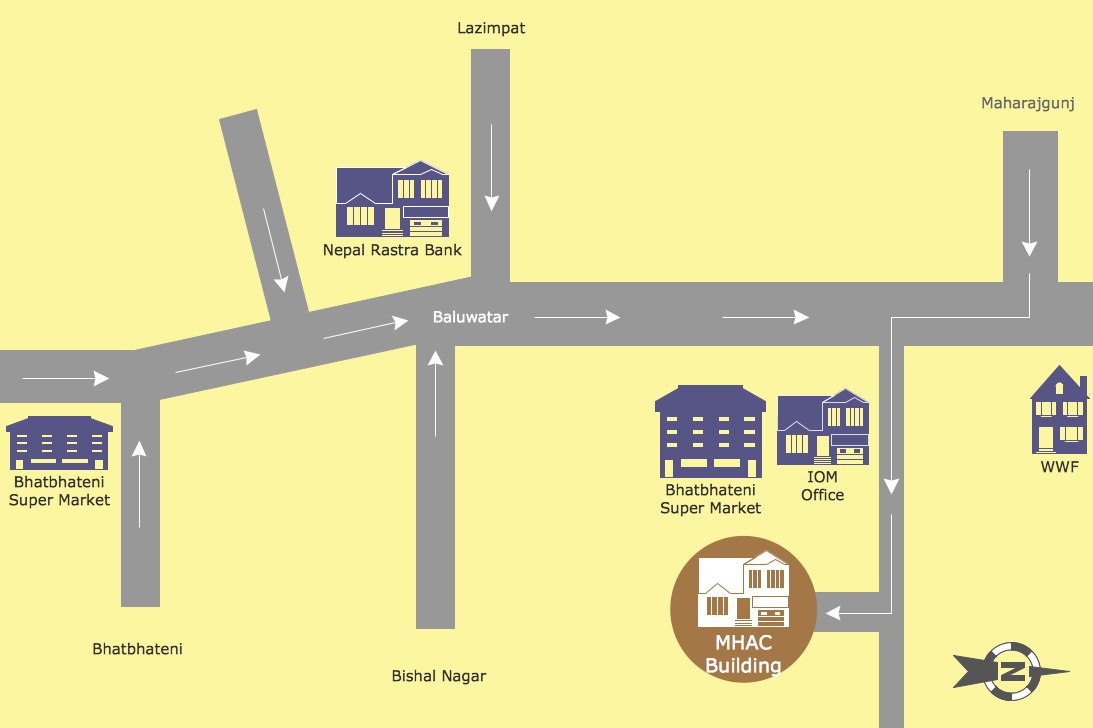
Map Directions
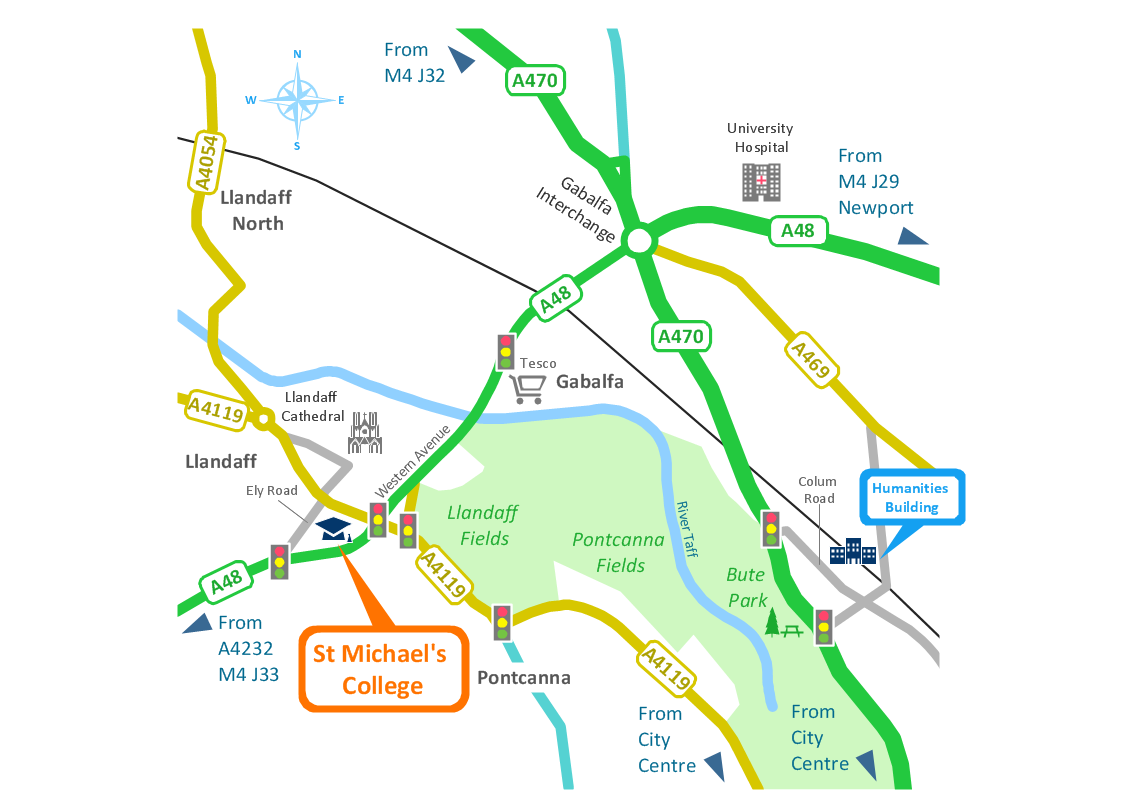
ConceptDraw PRO software extended with Directional Maps Solution from the Maps Area of ConceptDraw Solution Park offers you the set of useful tools for easy drawing map directions, directional maps, road maps, navigation schemes, transit maps of any complexity, etc.Building Drawing Software for Design Site Plan
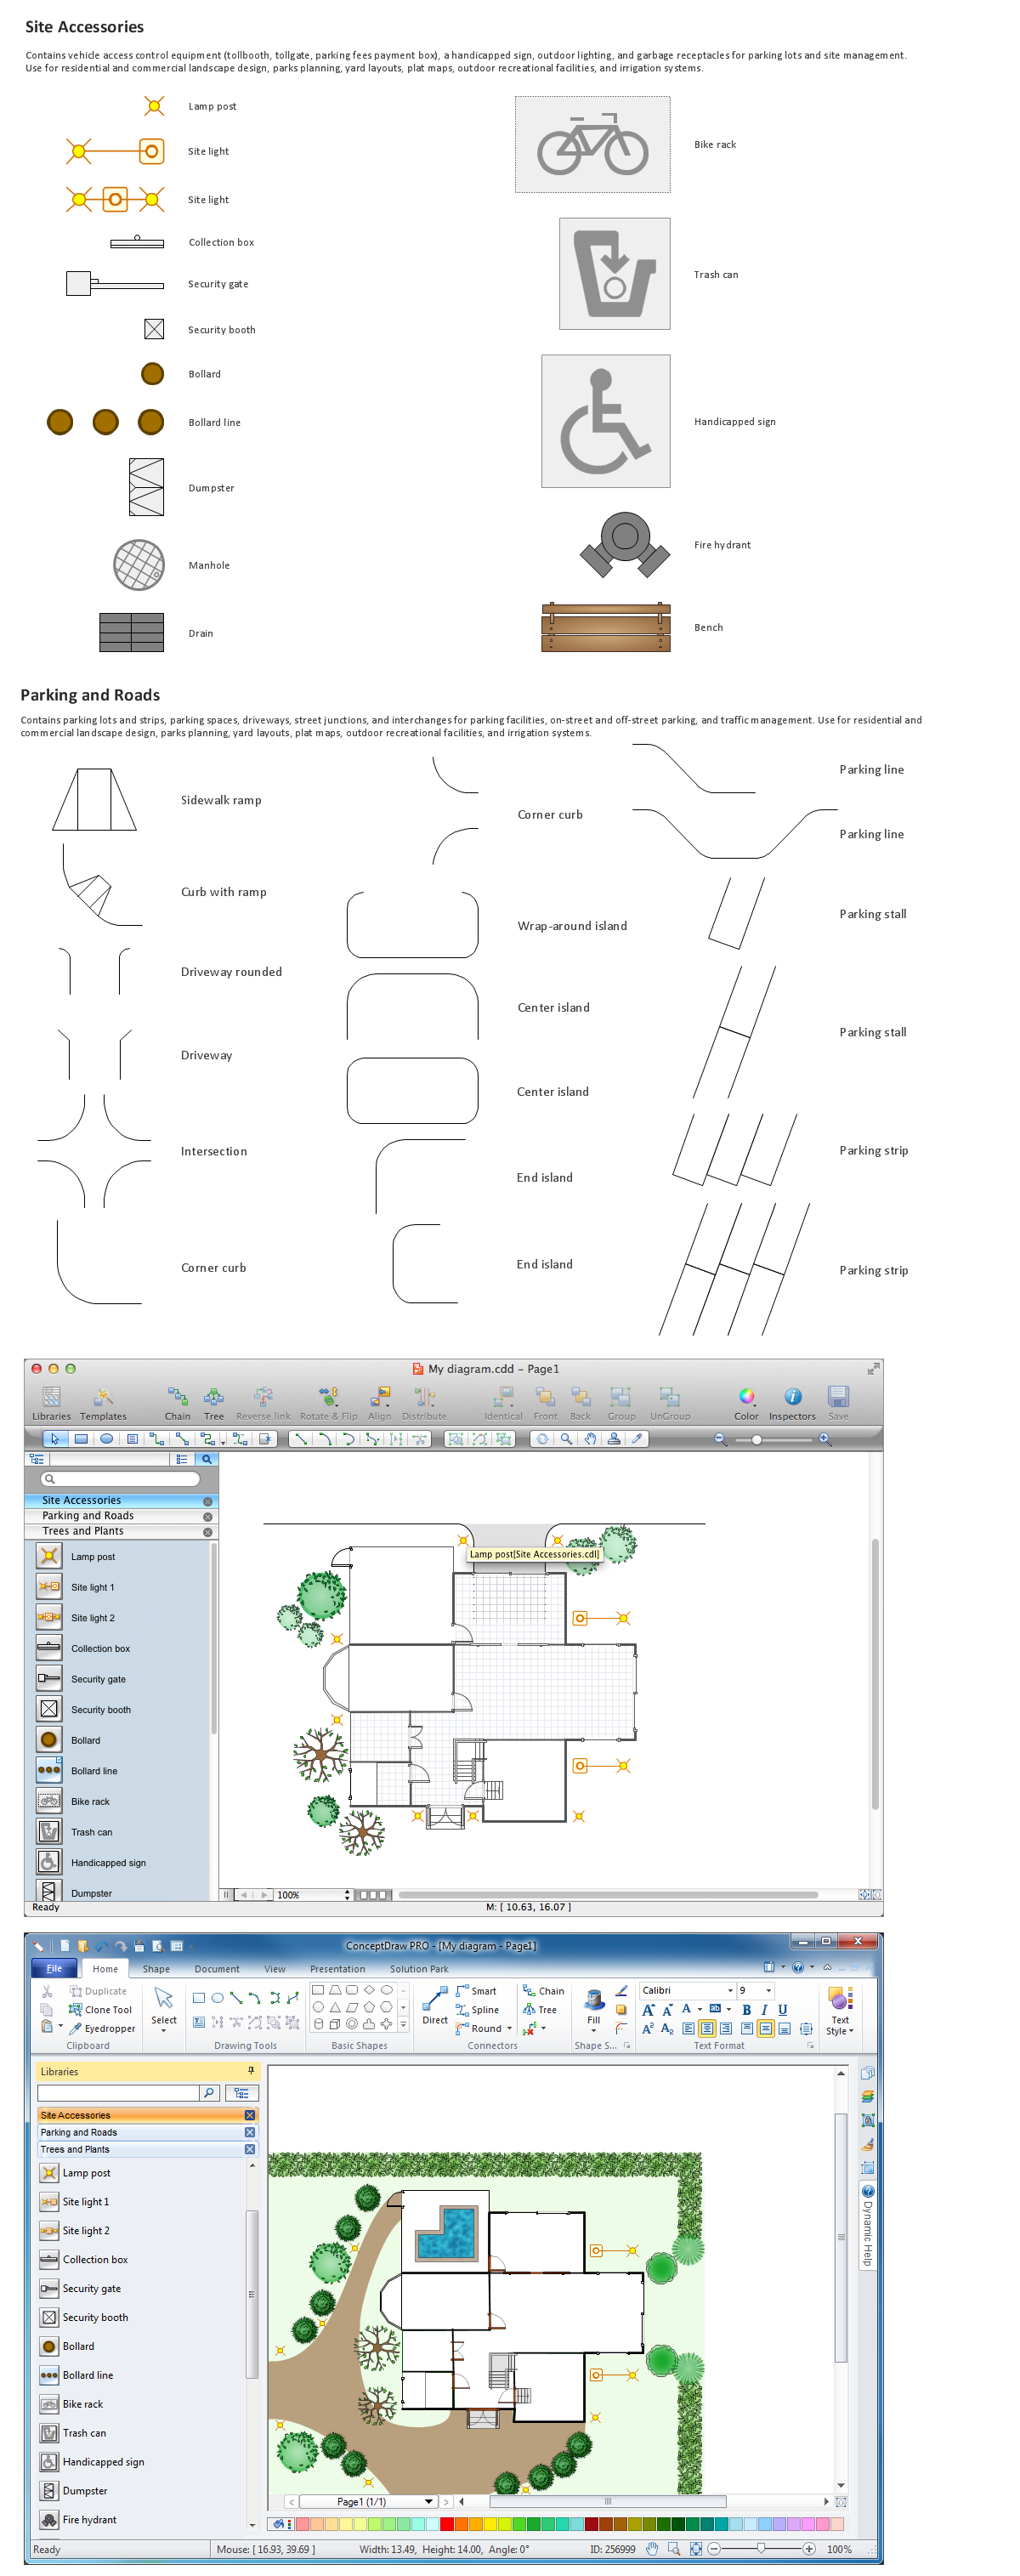
Site plan is a detailed architectural plan or document, landscape architecture project for considered object. It is a part of technical design documentation that illustrates the arrangement of buildings, trails, roads, parking, lighting, water lines, sanitary sewer lines, drainage facilities, landscape and garden elements. Site plans are constructed by architects, landscape designers or licensed design engineers, and used by the builders, contractors and installers when constructing or making improvements to some property. They reflect the main design ideas and give an instantly vision of future result after the plan's implementation. They have special value for the large projects of single or multi-floor buildings, and for accomplishment the whole districts. ConceptDraw PRO extended with Site Plans solution offers the powerful building drawing software tools and vector design elements for development and drawing Site plans and Landscape design drawings, Residential and Commercial landscape designs, Parks and Landscaping territories plans, Yard layouts, etc.
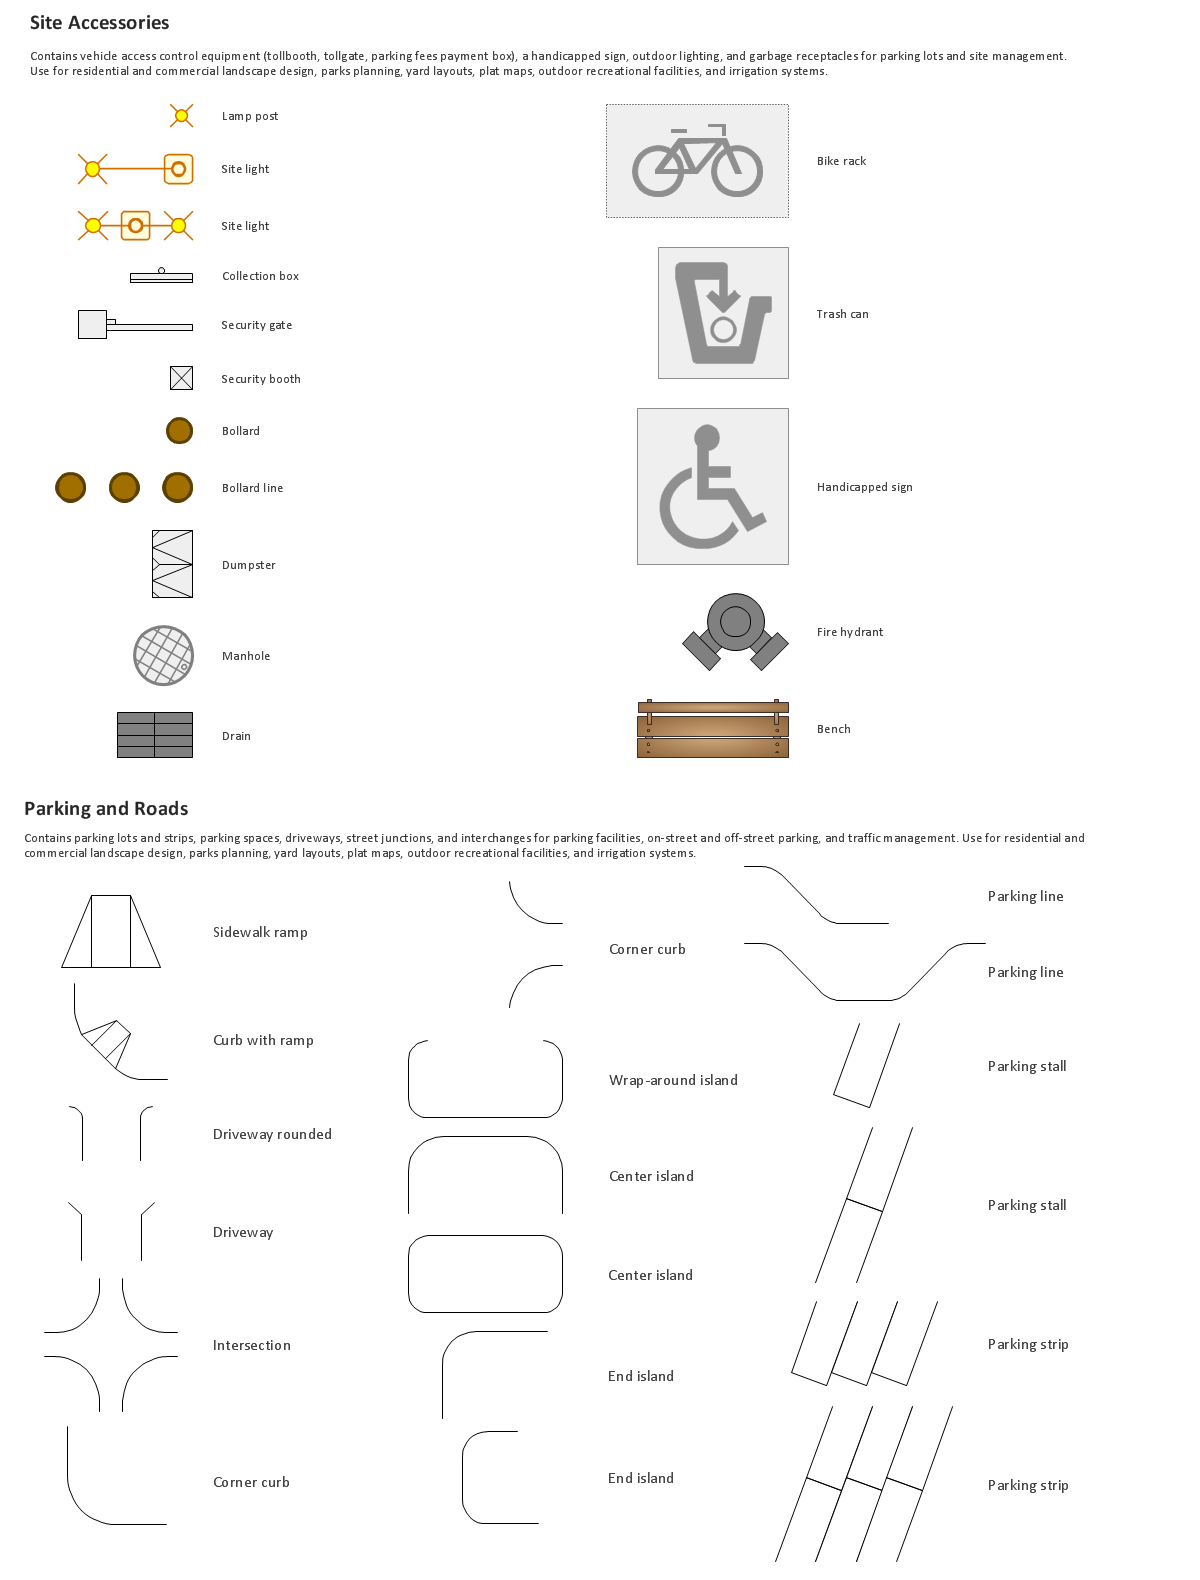
Building Drawing Design Element Site Plan
Site Plan is a part of a development project. It is a visual graphic representation of the arrangement of buildings, parking for cars and bikes, drives, landscaping, parks, flowerbeds, benches and other structural elements on the plan. Depending on the degree of detailing you can see on the Site plan more or fewer of building constructions and landscape design elements. ConceptDraw PRO Solution Park includes a specially developed Site Plans solution from the Building Plans area, which offers templates, samples, examples, and a lot of predesigned building drawing design elements for Site plan. The set of design elements contains the exclusive vector shapes of site accessories, parking, roads, trees, plants, etc. So, with confidence we can say that ConceptDraw PRO software with Site Plans solution is the best help for all in development and drawing your own Residential and Commercial landscape designs, Site plans, Park plans, Yard layouts, Outdoor recreational facilities and Irrigation system plans, and many others.
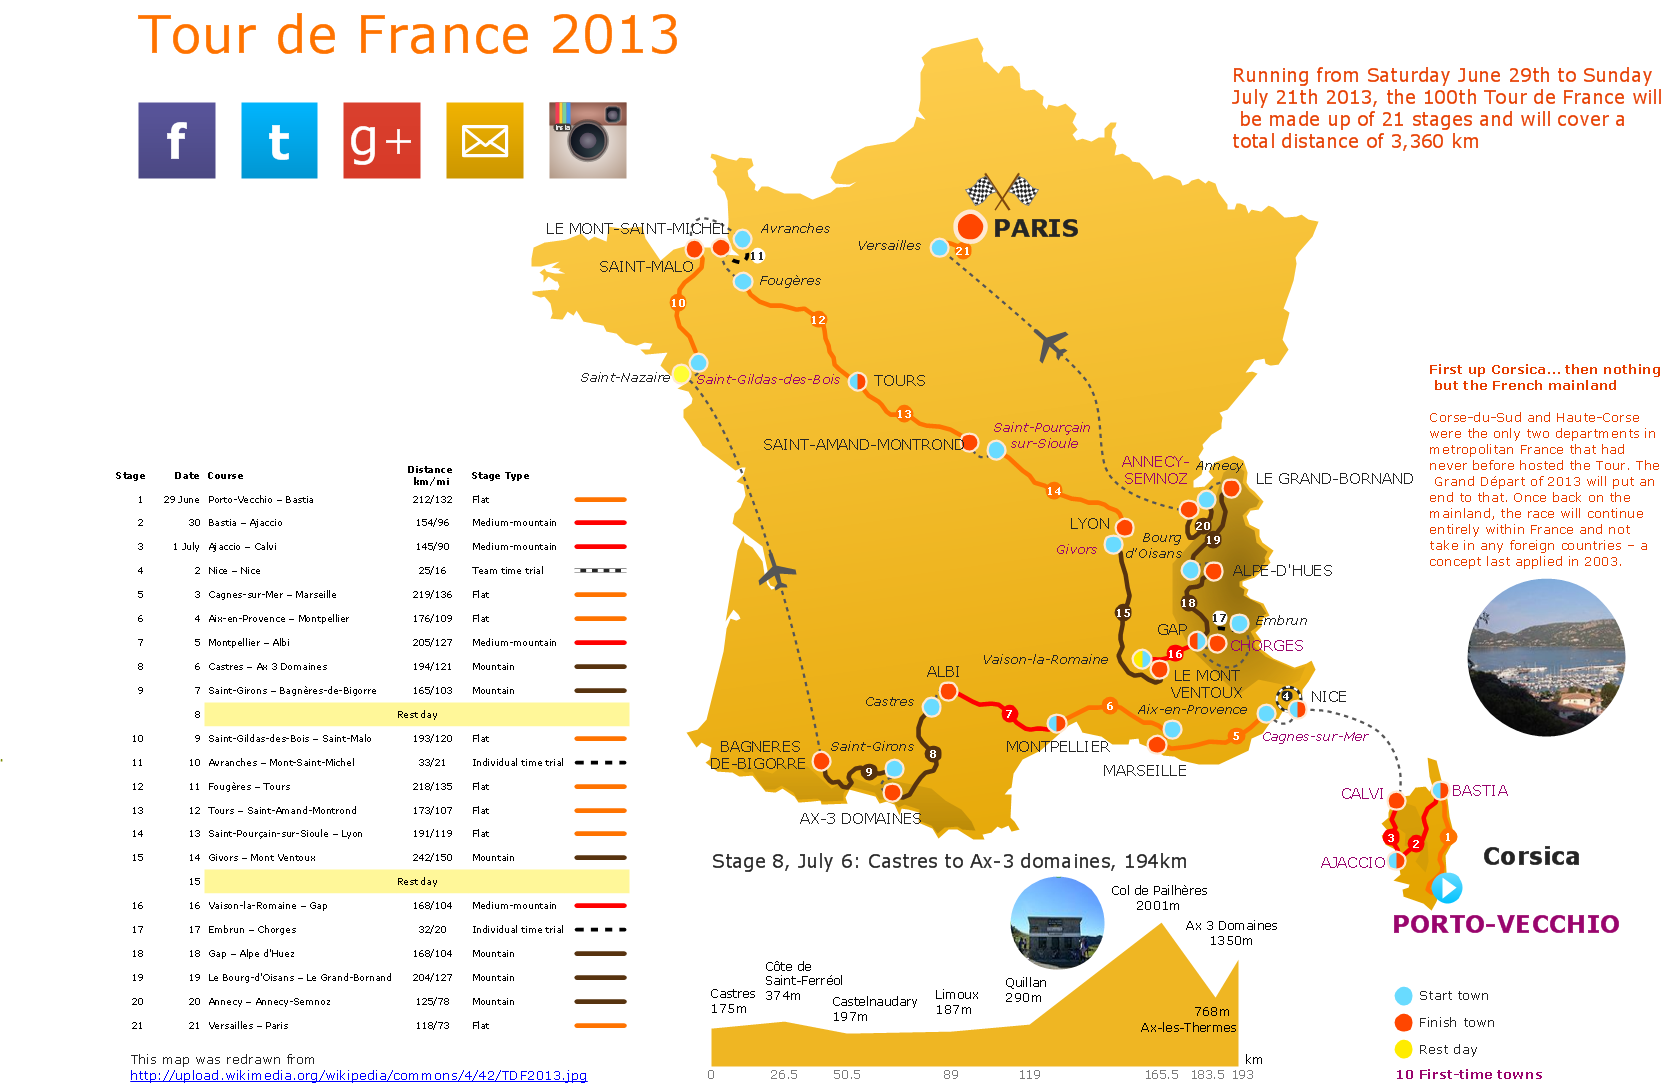
Brilliant Examples of Infographics Map, Transport, Road
ConceptDraw PRO contains spatial infographics samples, map templates to be filled in, and libraries of vector stencils for main design elements of spatial infographics.Superb Examples of Infographic Maps
Great examples of Infographic Maps, they are needed for inspiration.Spatial infographics Design Elements: Location Map
Infographic Design Elements for visually present various geographically distributed information.Excellent Examples of Infographic Maps
Create Spatial infographics with ConceptDraw using its excellent examples of infographic maps. We hope these can inspire and teach you!
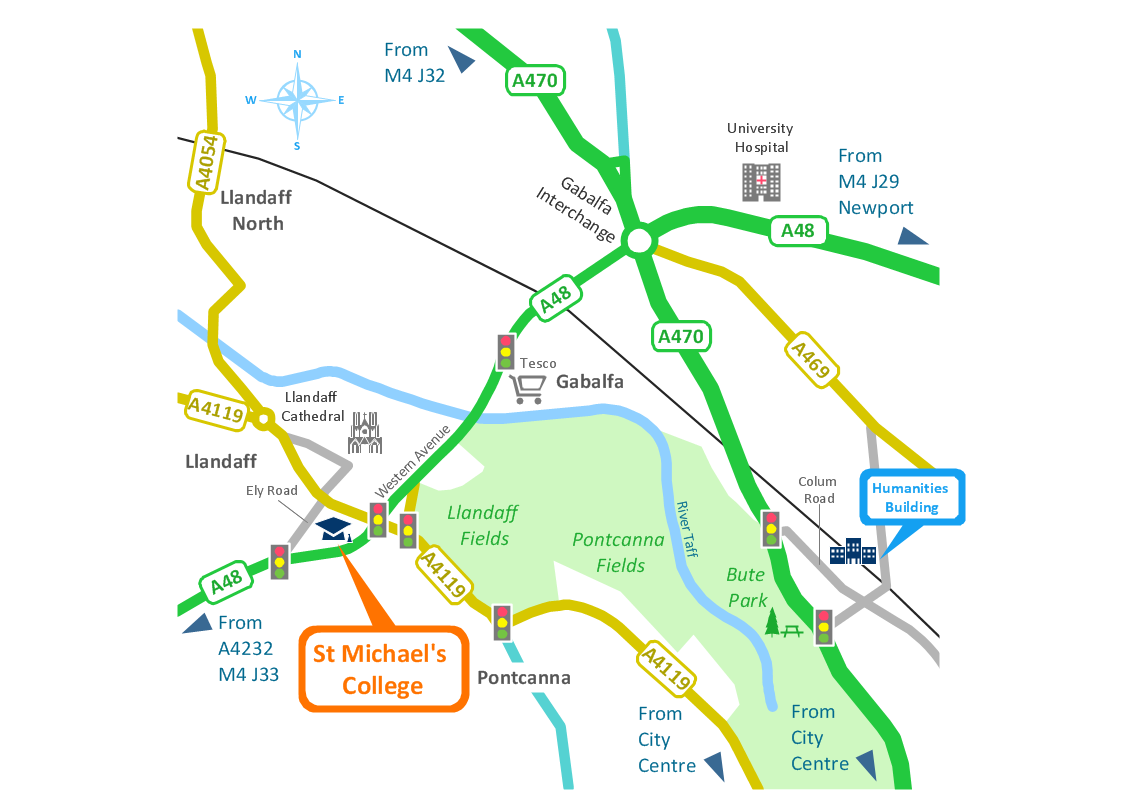
 Directional Maps
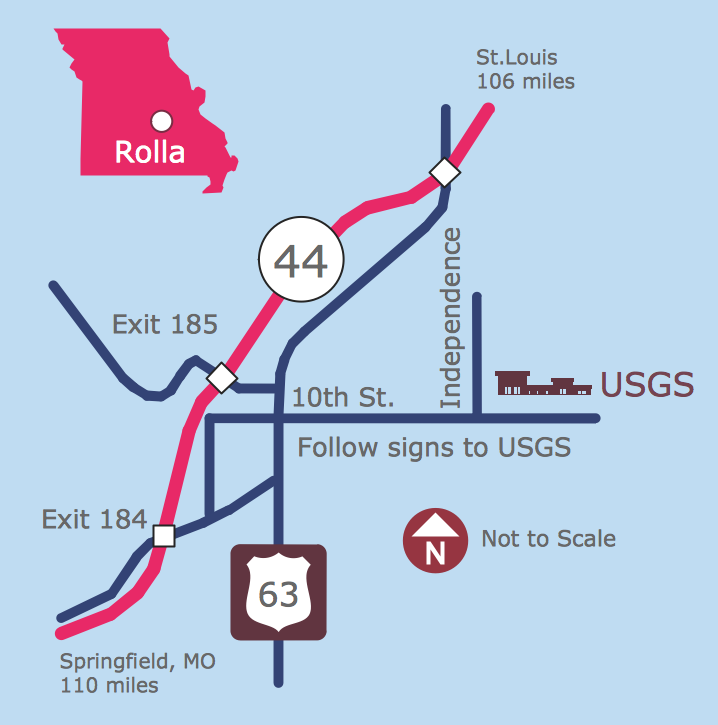
Directional Maps solution extends ConceptDraw PRO software with templates, samples and libraries of vector stencils for drawing the directional, location, site, transit, road and route maps, plans and schemes.
Directions Map
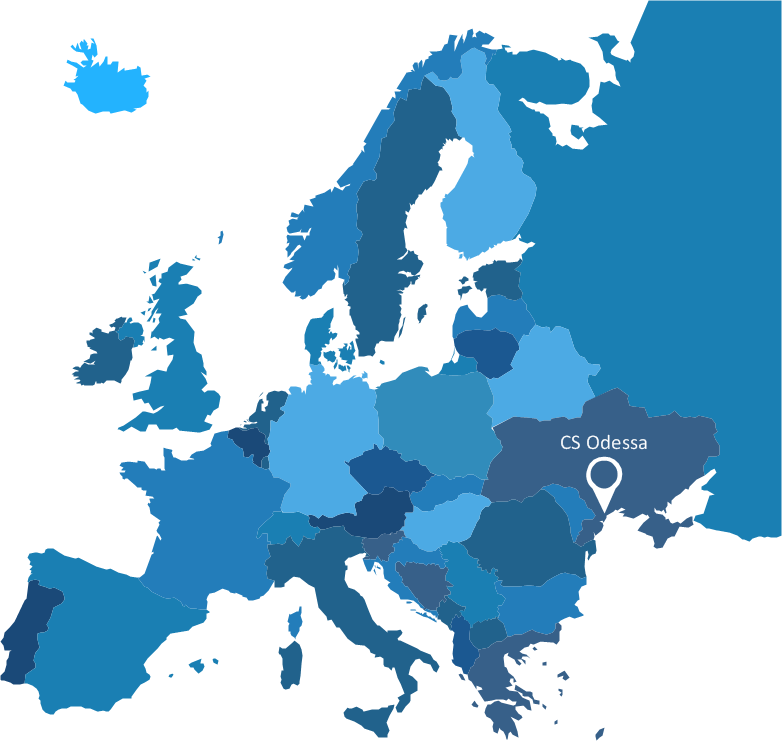
ConceptDraw PRO is a powerful diagramming and vector drawing software. Extended with Directional Maps Solution from the Maps Area of ConceptDraw Solution Park, it became the best software for quick and easy designing Directions Map of any complexity.Spatial infographics Design Elements: Continental Map
ConceptDraw PRO is a software for making infographics illustrations. You can work with various components to build really impressive and easy-to-understand infographics design.Maps and Directions
ConceptDraw PRO diagramming and vector drawing software extended with Directional Maps Solution from the Maps Area of ConceptDraw Solution Park is a powerful maps and directions design software. Let's review the tools of this solution.Cross-Functional Flowchart
Use of Cross-Functional Flowchart is a clear way of showing each team member’s responsibilities and how processes get shared or transferred between different responsible people, teams and departments. Use the best flowchart maker ConceptDraw PRO with a range of standardized cross-functional flowchart symbols to create the Cross-Functional Flowcharts simply and to visualize the relationship between a business process and the functional units responsible for that process. To draw the most quickly Cross-Functional Flowcharts, Cross Functional Process Maps, or Cross Functional Process Flow Diagrams, start with a Cross-functional flowchart samples and templates from ConceptDraw Solution Park. The ConceptDraw Arrows10 and RapidDraw technologies will be also useful for you in drawing. ConceptDraw PRO supports designing both types - horizontal and vertical Cross-functional flowcharts. A vertical layout makes the accents mainly on the functional units while a horizontal layout - on the process. If you need a Visio alternative in Mac OS X, try ConceptDraw PRO. Its interface is very intuitive and it’s actually much easier to use than Visio, yet somehow it’s just as powerful if not more so. ConceptDraw PRO performs professional quality work and seamless Visio interaction.
Tools to Create Your Own Infographics
Over the past few centuries, data visualization has evolved so much that we use it every day in all areas of our lives. Many believe that infographic is an effective tool of storytelling, as well as analytics, and that it is able to overcome most of the language and educational barriers. Understanding the mechanisms of human perception will help you to understand how abstract forms and colors used in data visualization can transmit information more efficient than long paragraphs of text.How tо Represent Information Graphically
ConceptDraw Infographics is a great visual tool for communicating the large amounts of data and graphic visualization and representations of data and information.Best Tool for Infographic Construction
ConceptDraw is a best data visualization tool that will allow everyone to create rich infographics and visualizations quickly and easily.- Building Drawing Software for Design Site Plan | Directions Maps ...
- Building Drawing Software for Design Site Plan | Road Transport ...
- Directional Maps | How to Create a Directional Map Using ...
- Site Plans | Building Drawing Software for Design Site Plan | Road ...
- Draw The Symbol Shown In Map Church
- Geo Mapping Software Examples - World Map Outline | Fire Exit ...
- Drawing Roads Map Soft
- Road Map Drawing Software
- Maps | Map Directions | 2D Directional map - Template | Road Maps
- Directional Map Drawing Software
- Building Drawing Software for Design Site Plan | Interior Design Site ...
- Simple Way To Draw Road Map
- 3d Drawing Maps
- Road Map
- Brilliant Examples of Infographics Map , Transport, Road | Directional ...
- Fire Exit Plan. Building Plan Examples | Emergency Plan | Transport ...
- Road Transport - Design Elements | Building Drawing Software for ...
- Fire Exit Plan. Building Plan Examples | How To Draw Building ...
- How To Draw Building Plans | Design elements - Location map ...
- Fire Exit Plan. Building Plan Examples | Transport map - Vector ...
