Sales Growth. Bar Graphs Example
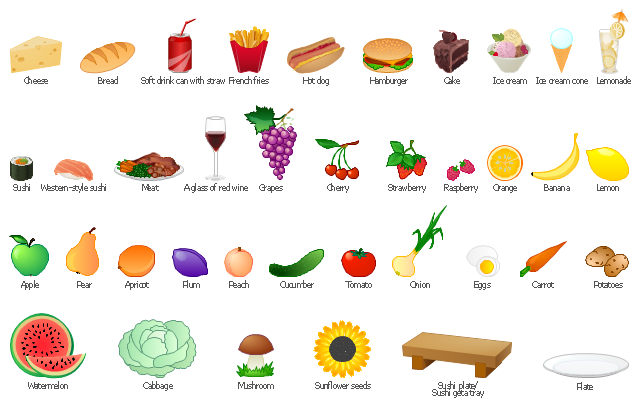
This sample was created in ConceptDraw PRO diagramming and vector drawing software using the Bar Graphs Solution from Graphs and Charts area of ConceptDraw Solution Park. It is Bar Graphs example, Sales Growth example, Column Chart Example - Sales Report.The illustration example "Design elements - Food" shows vector images of food, fruits and vegetables, fast food and desserts from the ConceptDraw PRO clipart library Food.
Use the vector stencils library Food to draw your own illustrations on meal and drink, food and beverage, diet, cuisine, cooking, healty nutrition, fast food.
"Food is any substance consumed to provide nutritional support for the body. It is usually of plant or animal origin, and contains essential nutrients, such as carbohydrates, fats, proteins, vitamins, or minerals. The substance is ingested by an organism and assimilated by the organism's cells in an effort to produce energy, maintain life, or stimulate growth." [Food. Wikipedia]
The illustration example "Design elements - Food" is included in the Artwork solution from the Illustration area of ConceptDraw Solution Park.
Pictures of Graphs
ConceptDraw PRO diagramming and vector drawing software extended with Picture Graphs solution from the Graphs and Charts Area is the best choice for making professional looking pictures of graphs and colorful picture graphs.Use the vector clipart library Food to draw illustrations on meal and drink, food and beverage, diet, cuisine, cooking, healty nutrition, fast food.
"Food is any substance consumed to provide nutritional support for the body. It is usually of plant or animal origin, and contains essential nutrients, such as carbohydrates, fats, proteins, vitamins, or minerals. The substance is ingested by an organism and assimilated by the organism's cells in an effort to produce energy, maintain life, or stimulate growth." [Food. Wikipedia]
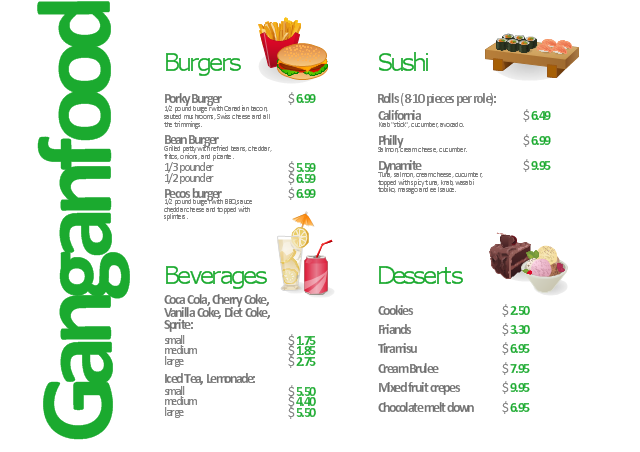
The vector graphics example Fast food restaurant menu prices was created using ConceptDraw PRO diagramming and vector drawing software extended with Artwork solution from Illustration area of ConceptDraw Solution Park.
Mind Mapping in the Quality Management
ConceptDraw MINDMAP has a addition to the ConceptDraw Solution Park that provides a creative approach to visualizing quality processes, Quality Mind Map Solution.Basic Diagramming
Create flowcharts, organizational charts, bar charts, line graphs, and more with ConceptDraw PRO.
 Matrices
This solution extends ConceptDraw PRO software with samples, templates and library of design elements for drawing the business matrix diagrams.
Donut Chart Templates
These donut chart templates was designed using ConceptDraw PRO diagramming and vector drawing software extended with Pie Charts solution from Graphs and Charts area of ConceptDraw Solution Park. All these donut chart templates are included in the Pie Charts solution. You can quickly rework these examples into your own charts by simply changing displayed data, title and legend texts.Bar Diagrams for Problem Solving. Create event management bar charts with Bar Graphs Solution
Create bar charts for event management problem solving and visual data comparison using the ConceptDraw PRO diagramming and vector drawing software extended with the Bar Graphs Solution from the Graphs and Charts area of ConceptDraw Solition Park.
 Area Charts
Area Charts are used to display the cumulative totals over time using numbers or percentages; or to show trends over time among related attributes. The Area Chart is effective when comparing two or more quantities. Each series of data is typically represented with a different color, the use of color transparency in an object’s transparency shows overlapped areas and smaller areas hidden behind larger areas.
 Line Graphs
How to draw a Line Graph with ease? The Line Graphs solution extends the capabilities of ConceptDraw PRO v10 with professionally designed templates, samples, and a library of vector stencils for drawing perfect Line Graphs.
 Picture Graphs
Typically, a Picture Graph has very broad usage. They many times used successfully in marketing, management, and manufacturing. The Picture Graphs Solution extends the capabilities of ConceptDraw PRO v10 with templates, samples, and a library of professionally developed vector stencils for designing Picture Graphs.
 Frequency Distribution Dashboard
Frequency distribution dashboard solution extends ConceptDraw PRO software with samples, templates and vector stencils libraries with histograms and area charts for drawing the visual dashboards showing frequency distribution of data.
- Example Of Growth Food
- Design elements - Food | Sales Growth . Bar Graphs Example | Fast ...
- Design elements - Food | Fast food restaurant menu prices ...
- Example Of Energy Food
- Food Logo Vector Examples
- Sales Growth . Bar Graphs Example | Bar Diagrams for Problem ...
- Fast food restaurant menu prices | French Fries Menu Example
- Energy Pyramid Diagram | Fast food restaurant menu prices ...
- Cocktails And Food Menu Example
- Design elements - Fruits | Fruit Art | Food Court | Fruit Example Of ...
- Example Of The Fast Food
- Examples Of Fast Food
- Fast food restaurant menu prices | Design elements - Food | Biology ...
- Fast Food Examples
- Sample Fast Food Menu
- Fast Food Sample Menu
- Fast food restaurant menu prices
- Fast food restaurant menu prices | How to Design a Fast- Food ...
- How to Design a Fast- Food Restaurant Menu Using ConceptDraw ...
- Design elements - Dessert | Fruit Art | Design elements - Food ...


