Chore charts with ConceptDraw PRO

Polar Graph

Drawing Illustration

The Action Plan


How can you illustrate the weather condition

Holiday Recipes

Beautiful Nature Scene: Drawing

Flow chart Example. Warehouse Flowchart


Sketching Software

Matrices

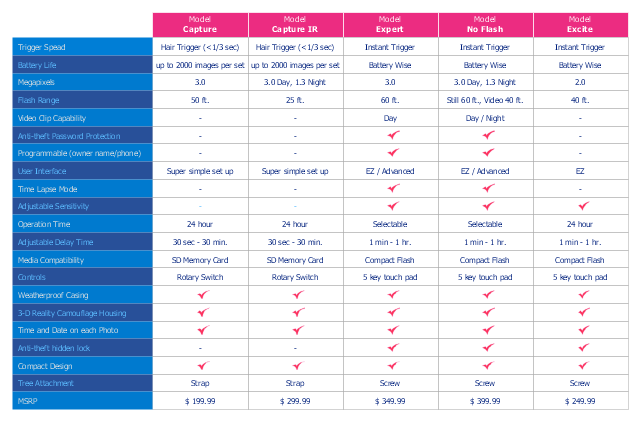
Competitive Feature Comparison Matrix is a tool to compare the features and functionality of competitive products or services in side-by-side table.
The feature comparison matrices are used for feature comparison analysis of competitive products and services.
This competitive feature comparison matrix chart example was created using the ConceptDraw PRO diagramming and vector drawing software extended with the Matrices solution from the Marketing area of ConceptDraw Solution Park.
Feature comparison chart
Deployment Chart Software

"Time management is the .. process of planning and exercising conscious control over the amount of time spent on specific activities, especially to increase effectiveness, efficiency or productivity. Time management may be aided by a range of skills, tools, and techniques used to manage time when accomplishing specific tasks, projects, and goals complying with a due date. Initially, time management referred to just business or work activities, but eventually the term broadened to include personal activities as well. A time management system is a designed combination of processes, tools, techniques, and methods. Time management is usually a necessity in any project development as it determines the project completion time and scope." [Time management. Wikipedia]
This timetable pie chart shows the plan of daily actions and its durations in minutes.
It is useful visual tool of personal time management.
This schedule pie chart example was created using the ConceptDraw PRO diagramming and vector drawing software extended with the Target and Circular Diagrams solution from the Marketing area of ConceptDraw Solution Park.
www.conceptdraw.com/ solution-park/ marketing-target-and-circular-diagrams
Daily activities pie chart

- Example Of Chore List
- Examples Of Chores Charts
- Examples Of Chores Chart
- Chore charts with ConceptDraw PRO | Building Drawing Design ...
- Chore chart - Template | Deployment chart - Template | Matrices ...
- Chore chart - Template | Deployment chart - Template | Chore ...
- To Do Charts
- Chore Chart Examples
- Chore chart - Template | Deployment chart - Template | Matrices ...
- Chore charts with ConceptDraw PRO | Chore chart - Template ...
- Chore chart - Template | Deployment chart - Template | Matrices ...
- Chore Chart Example
- How to Create Presentation of Your Project Gantt Chart | How to ...
- Funny animals - Vector stencils library | Sketching Software | Chore ...
- Chore chart - Template | Deployment chart - Template | Top 5 ...
- Types of Flowchart - Overview | Chore charts with ConceptDraw ...
- Checklist Diagram Example
- Chart For Nature
- Chore charts with ConceptDraw PRO | Design elements - Site ...
- Holiday Recipes | Chore charts with ConceptDraw PRO | Cooking ...