Swot Analysis Examples

Flowchart Marketing Process. Flowchart Examples

Competitor Analysis

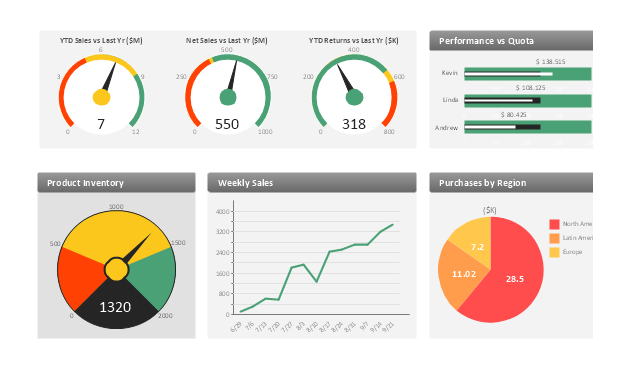
This sales manager dashboard example includes KPIs graphic indicators and business metrics charts: gauge (speedometer) indicators - "YTD Sales vs. Last Year", "Net Sales vs. Last Year", "YTD Returns vs. Last Year", "Product Inventory", bullet indicators - "Performance vs. Quota", line chart - "Weekly Sales", pie chart - "Purchases by Region".
The performance dashboard example "Sales manager dashboard" was created using the ConceptDraw PRO diagramming and vector drawing software extended with the Sales Dashboard solution from the Marketing area of ConceptDraw Solution Park.
www.conceptdraw.com/ solution-park/ marketing-sales-dashboard
The performance dashboard example "Sales manager dashboard" was created using the ConceptDraw PRO diagramming and vector drawing software extended with the Sales Dashboard solution from the Marketing area of ConceptDraw Solution Park.
www.conceptdraw.com/ solution-park/ marketing-sales-dashboard
Sales dashboard
Flowchart Example: Flow Chart of Marketing Analysis

 Fishbone Diagrams
The Fishbone Diagrams solution extends ConceptDraw DIAGRAM software with the ability to easily draw the Fishbone Diagrams (Ishikawa Diagrams) to clearly see the cause and effect analysis and also problem solving. The vector graphic diagrams produced using this solution can be used in whitepapers, presentations, datasheets, posters, and published technical material.
How To Plan and Implement Projects Faster

Fishbone Diagram Problem Solving

SWOT Analysis

- Key Performance Indicators Examples Sales
- Performance Indicators | Sales Performance | Constant improvement ...
- Performance Indicators Examples
- Sales metrics and KPIs - Visual dashboard | Sales KPIs ...
- Sales performance dashboard | Design elements - Sales KPIs and ...
- Sales Growth. Bar Graphs Example | Sales Dashboards for Your ...
- Logistics Performance Dashboard - Template | Sales KPIs ...
- Performance Indicators | Design elements - Sales dashboard | How ...
- Performance Indicators | Constant improvement of key performance ...
- Cafe performance metrics vs. air temperature - Visual dashboard ...