This site uses cookies. By continuing to browse the ConceptDraw site you are agreeing to our Use of Site Cookies.

TQM Diagram Example

The Total Quality Management Diagram solution helps you and your organization visualize business and industrial processes. Create Total Quality Management diagrams for business process with ConceptDraw software.

Basic Diagramming

Create flowcharts, organizational charts, bar charts, line graphs, and more with ConceptDraw DIAGRAM.

How to Make SWOT Analysis in a Word Document

A SWOT Analysis is a popular strategic planning tool used to evaluate the Strengths, Weaknesses, Opportunities, and Threats involved in any businesses. You can export your SWOT mind map into a MS Word document, which makes using SWOT mind map easier if you need to collaborate it with other people.
ConceptDraw products across any platform, meaning you never have to worry about compatibility again. ConceptDraw MINDMAP allows you to make SWOT analysis on PC or macOS operating systems.

Picture Graph

A Picture Graph is a popular and widely used type of a bar graph, which represents data in various categories using the pictures. ConceptDraw DIAGRAM extended with Picture Graphs solution from the Graphs and Charts area of ConceptDraw Solution Park is the best software for fast and simple drawing professional looking Picture Graphs.

Growth-Share Matrix Software

Growth-Share Matrix Software - ConceptDraw DIAGRAM is a powerful diagramming and vector drawing software for creating professional looking Growth–Share Matrices. For simple and quick creating the Growth–Share Matrix ConceptDraw DIAGRAM offers the Matrices Solution from the Marketing Area of ConceptDraw Solution Park.
The Matrices Solution also provides a wide variety of templates and samples that will help you to create the Matrix diagrams of any difficulty.

Percentage Pie Chart. Pie Chart Examples

This sample was created in ConceptDraw DIAGRAM diagramming and vector drawing software using the Pie Charts Solution from Graphs and Charts area of ConceptDraw Solution Park.
This sample shows the Pie Chart of the approximate air composition. You can see the percentage of oxygen, nitrogen and other gases in the air visualized on this Pie Chart.

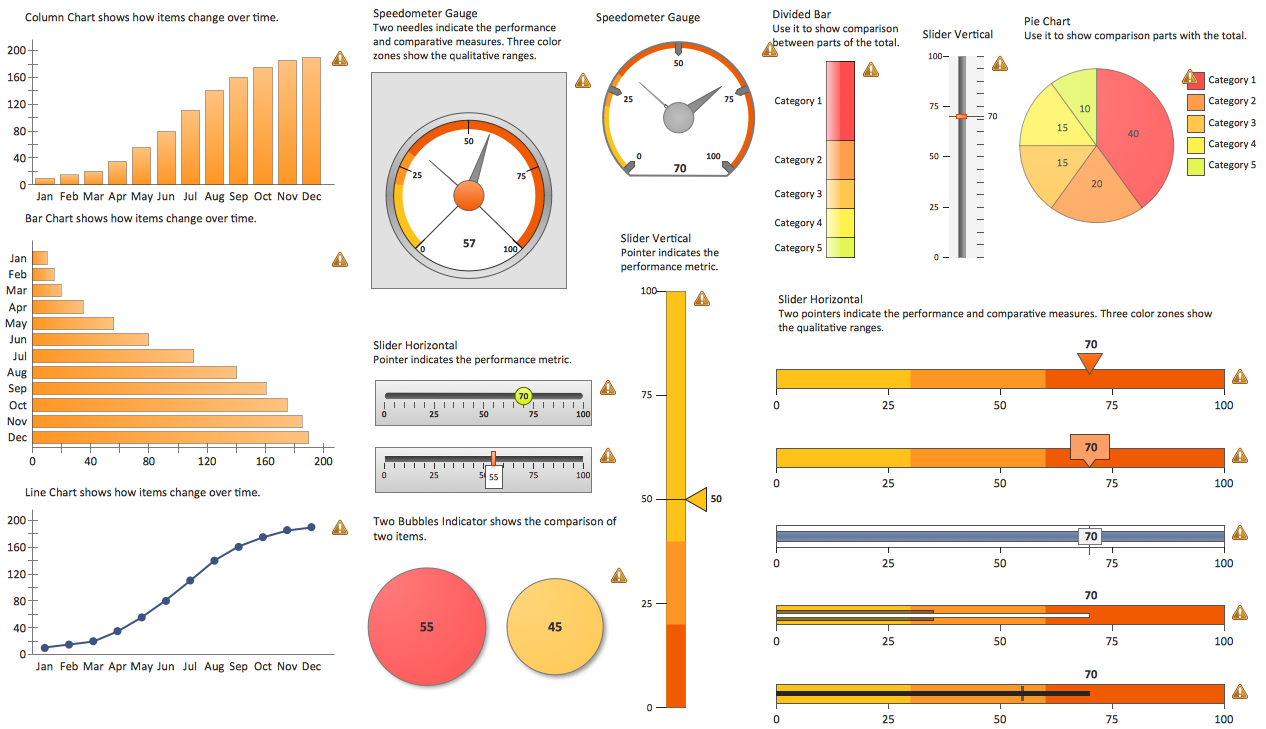
Sales Dashboards for Your Company

ConceptDraw DIAGRAM software extended with the Sales Dashboard solution allows you produce sales dashboards for your company easily. You can start from samples and templates delivered with the solution and then modify them to get a dashboard that suites your specific needs.

marketing, process, chart, Marketing Charts, Marketing Diagrams,  solution park Marketing

marketing, process, chart, Marketing Charts, Marketing Diagrams,  solution park
This solution extends ConceptDraw DIAGRAM and ConceptDraw MINDMAP with Marketing Diagrams and Mind Maps (brainstorming, preparing and holding meetings and presentations, sales calls).

Polar Graph

This sample shows the Polar Graph. The Polar Graph is a graph in the polar coordinate system in which the each point on the plane is defined by two values - the polar angle and the polar radius. The certain equations have very complex graphs in the Cartesian coordinates, but the application of the polar coordinate system allows usually produce the simple Polar Graphs for these equations.

Pyramid Diagram

ConceptDraw Pyramid Diagram software allows drawing column charts using predesigned objects or drawing tools.

SWOT Analysis Solution - Strategy Tools

A SWOT analysis helps professionals to identify the positives and negatives in the organization and in the external environment.

SWOT Sample in Computers

The ConceptDraw is a best diagram software. The SWOT Analysis solution includes the SWOT matrix samples, and templates that allow users create own SWOT diagram.

Swot Analysis Examples

SWOT Analysis solution from ConceptDraw Solution Park extends ConceptDraw DIAGRAM software with SWOT and TOWS matrix diagram examples and templates, that help identify and analyze Strengths, Weaknesses, Opportunities, and Threats.

Pictures of Graphs

ConceptDraw DIAGRAM diagramming and vector drawing software extended with Picture Graphs solution from the Graphs and Charts Area is the best choice for making professional looking pictures of graphs and colorful picture graphs.

Business Report Pie. Pie Chart Examples

This sample shows the Business Report Pie Chart. The Pie Chart visualizes the data as the proportional parts of a whole, illustrates the numerical proportion. Pie Charts are very useful in the business, statistics, analytics, mass media.