HelpDesk
How to Draw a Divided Bar Chart in ConceptDraw PRO

 Divided Bar Diagrams
The Divided Bar Diagrams Solution extends the capabilities of ConceptDraw PRO v10 with templates, samples, and a library of vector stencils for drawing high impact and professional Divided Bar Diagrams and Graphs, Bar Diagram Math, and Stacked Graph.
Stacked Graph

Relative Value Chart Software

Relative values are widely used in:business, economics, investment, management, marketing, statistics, etc.
ConceptDraw PRO software is the best for drawing professional looking Relative Value Charts. ConceptDraw PRO provides Divided Bar Diagrams solution from the Graphs and Charts Area of ConceptDraw Solution Park.
A Divided Bar graph is a rectangle divided into smaller rectangles along its length in proportion to the data. Segments in a Divided Bar represent a set of quantities according to the different proportions of the total amount.
The example "Divided bar graph - Global natural gas consumption (2010)" was drawn on the base of International Energy Statistics from the U.S. Energy Information Administration (EIA) website. [eia.gov/ cfapps/ ipdbproject/ IEDIndex3.cfm?tid=3&pid=26&aid=2]
"Natural gas is a fossil fuel formed when layers of buried plants and animals are exposed to intense heat and pressure over thousands of years. The energy that the plants originally obtained from the sun is stored in the form of chemical bonds in natural gas. Natural gas is a nonrenewable resource because it cannot be replenished on a human time frame. Natural gas is a hydrocarbon gas mixture consisting primarily of methane, but commonly includes varying amounts of other higher alkanes and even a lesser percentage of carbon dioxide, nitrogen, and hydrogen sulfide. Natural gas is an energy source often used for heating, cooking, and electricity generation. It is also used as fuel for vehicles and as a chemical feedstock in the manufacture of plastics and other commercially important organic chemicals." [Natural gas. Wikipedia]
The diagram example "Divided bar graph - Global natural gas consumption (2010)" was created using ConceptDraw PRO diagramming and vector drawing software extended with the Divided Bar Diagrams solution from the Graphs and Charts area of ConceptDraw Solution Park.
Divided bar chart
---divided-bar-graph.png--diagram-flowchart-example.png)
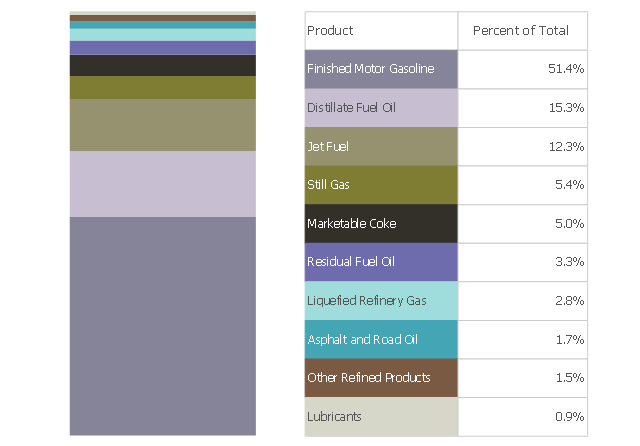
This divided bar chart example was drawn on the base of the picture "Petroleum Products Yielded from One Barrel of Crude Oil in California" from the California Energy Almanac website. [energyalmanac.ca.gov/ gasoline/ whats_ in_ barrel_ oil.html]
"Petroleum products are useful materials derived from crude oil (petroleum) as it is processed in oil refineries. Unlike petrochemicals, which are a collection of well-defined usually pure chemical compounds, petroleum products are complex mixtures. The majority of petroleum is converted to petroleum products, which includes several classes of fuels.
According to the composition of the crude oil and depending on the demands of the market, refineries can produce different shares of petroleum products. The largest share of oil products is used as "energy carriers", i.e. various grades of fuel oil and gasoline. These fuels include or can be blended to give gasoline, jet fuel, diesel fuel, heating oil, and heavier fuel oils. Heavier (less volatile) fractions can also be used to produce asphalt, tar, paraffin wax, lubricating and other heavy oils. Refineries also produce other chemicals, some of which are used in chemical processes to produce plastics and other useful materials. Since petroleum often contains a few percent sulfur-containing molecules, elemental sulfur is also often produced as a petroleum product. Carbon, in the form of petroleum coke, and hydrogen may also be produced as petroleum products. The hydrogen produced is often used as an intermediate product for other oil refinery processes such as hydrocracking and hydrodesulfurization." [Petroleum product. Wikipedia]
The divided bar diagram example "Petroleum products yielded from one barrel of crude oil" was created using the ConceptDraw PRO diagramming and vector drawing software extended with the Divided Bar Diagrams solution from the Graphs and Charts area of ConceptDraw Solution Park.
Divided bar chart
Bar Diagram Math

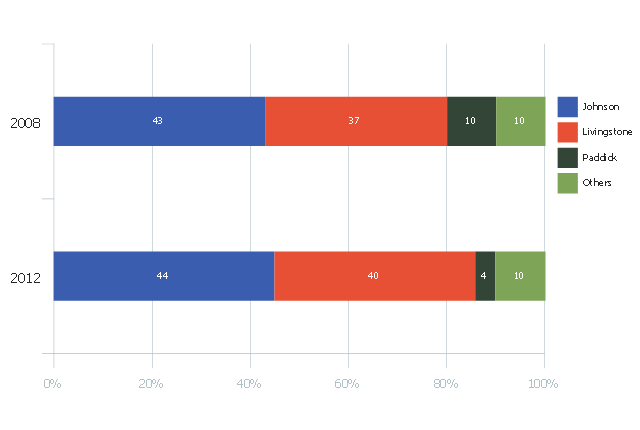
This divided bar chart sample was drawn on the base of the infographics "London Elections Results by Numbers" from the london.gov.uk website.
[data.london.gov.uk/ datastore/ package/ london-elections-results-2012-wards-boroughs-constituency]
"There are six types of elections in the United Kingdom: United Kingdom general elections, elections to devolved parliaments and assemblies, elections to the European Parliament, local elections, mayoral elections and Police and Crime Commissioner elections. Elections are held on Election Day, which is conventionally a Thursday. General elections do not have fixed dates, but must be called within five years of the opening of parliament following the last election. Other elections are held on fixed dates, though in the case of the devolved assemblies and parliaments early elections can occur in certain situations. Currently, six electoral systems are used: the single member plurality system (First Past the Post), the multi member plurality system, party list PR, the single transferable vote, the Additional Member System and the Supplementary Vote.
Elections are administered locally: in each lower-tier local authority, the actual polling procedure is run by the Returning Officer and the compiling and maintenance of the electoral roll by the Electoral Registration Officer (except in Northern Ireland, where the Electoral Office for Northern Ireland assumes both responsibilities). The Electoral Commission only sets standards for and issues guidelines to Returning Officers and Electoral Registration Officers, but is responsible for nationwide electoral administration (such as the registration of political parties and directing the administration of national referendums)." [Elections in the United Kingdom. Wikipedia]
The divided bar diagram example "London election results" was created using the ConceptDraw PRO diagramming and vector drawing software extended with the Divided Bar Diagrams solution from the Graphs and Charts area of ConceptDraw Solution Park.
Divided bar chart
Bar Graph

Bar Diagrams for Problem Solving. Create economics and financial bar charts with Bar Graphs Solution

Bar Diagrams for Problem Solving. Create manufacturing and economics bar charts with Bar Graphs Solution

Pie Chart Software

ConceptDraw PRO software with Pie Charts solution helps to create pie and donut charts for effective displaying proportions in statistics, business and mass media for composition comparison, i.e. for visualization of part percentage inside one total.
Pie Graph Worksheets

Bar Diagrams for Problem Solving. Create event management bar charts with Bar Graphs Solution

Basic Diagramming


- How to Draw a Divided Bar Chart in ConceptDraw PRO | London ...
- Divided bar diagram - Template | Chart Software for Better ...
- How to Draw a Divided Bar Chart in ConceptDraw PRO | Basic ...
- How to Draw a Divided Bar Chart in ConceptDraw PRO | Divided ...
- Bar Chart Examples | Divided bar diagram template | Bar Chart ...
- Divided bar diagram - Template | Bar Diagram Math | How to Draw a ...
- Divided Bar Diagrams | Bar Graphs | Graphs and Charts Area ...
- Divided Bar Diagrams | Bar Graphs | Bar Diagrams for Problem ...
- How to Draw a Divided Bar Chart in ConceptDraw PRO | Stacked ...
- How to Draw a Divided Bar Chart in ConceptDraw PRO ...
- How to Draw a Divided Bar Chart in ConceptDraw PRO | Divided ...
- How to Draw a Divided Bar Chart in ConceptDraw PRO ...
- How to Draw a Divided Bar Chart in ConceptDraw PRO | Bar Chart ...
- How to Draw a Divided Bar Chart in ConceptDraw PRO | Divided ...
- How to Draw a Divided Bar Chart in ConceptDraw PRO | Waterfall ...
- How to Draw a Divided Bar Chart in ConceptDraw PRO | Bar ...
- Bar Graphs | Divided Bar Diagrams | How to Draw a Divided Bar ...
- How to Draw a Divided Bar Chart in ConceptDraw PRO | How to ...
- Divided Bar Diagrams | Basic Diagramming | Design elements ...
- Divided Bar Diagrams | Bar Graphs | Bar Chart Template for Word ...