This exploded pie chart sample shows the economic sector weightings. It was designed on the base of the Wikimedia Commons file: Badpie.png [commons.wikimedia.org/ wiki/ File:Badpie.png].
This image is available under the Creative Commons Attribution-ShareAlike 3.0 Unported License [creativecommons.org/ licenses/ by-sa/ 3.0/ ].
"The classical breakdown of all economic sectors follows:
Primary: Involves the retrieval and production of raw materials, such as corn, coal, wood and iron. (A coal miner and a fisherman would be workers in the primary sector.)
Secondary: Involves the transformation of raw or intermediate materials into goods e.g. manufacturing steel into cars, or textiles into clothing. (A builder and a dressmaker would be workers in the secondary sector.)
Tertiary: Involves the supplying of services to consumers and businesses, such as baby-sitting, cinema and banking. (A shopkeeper and an accountant would be workers in the tertiary sector.)
In the 20th century, it began to be argued that traditional tertiary services could be further distinguished from "quaternary" and quinary service sectors." [Economic sector. Wikipedia]
The exploded pie chart example "Economic sector weightings" was created using the ConceptDraw PRO diagramming and vector drawing software extended with the Pie Charts solution of the Graphs and Charts area in ConceptDraw Solution Park.
Exploded pie chart

Bar Diagrams for Problem Solving. Create manufacturing and economics bar charts with Bar Graphs Solution

Bar Diagrams for Problem Solving. Create economics and financial bar charts with Bar Graphs Solution

Best Value — Total Quality Management

Column Chart Template

Recruitment

Competitor Analysis

Bar Diagram Math

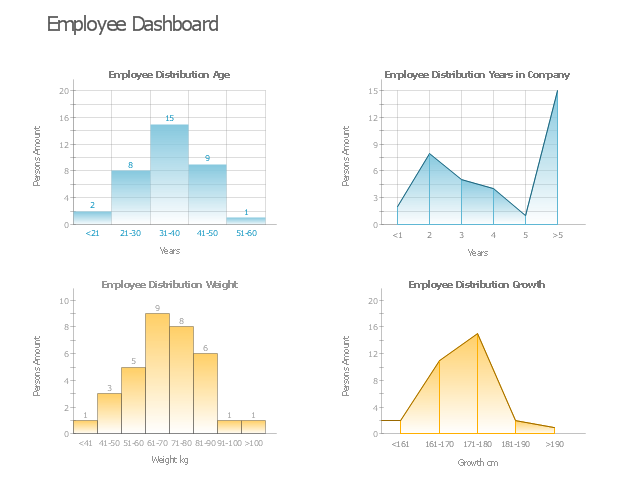
This HR dashboard example include histograms "Employee Distribution by Age" and "Employee Distribution by Weight", and area charts "Employee Distribution by Years in Company" and "Employee Distribution by Growth".
"Human resources is the set of individuals who make up the workforce of an organization, business sector, or economy. "Human capital" is sometimes used synonymously with human resources, although human capital typically refers to a more narrow view (i.e., the knowledge the individuals embody and can contribute to an organization). Likewise, other terms sometimes used include "manpower", "talent", "labour", or simply "people". The professional discipline and business function that oversees an organization's human resources is called human resource management (HRM, or simply HR)." [Human resources. Wikipedia]
The example "HR dashboard" was created using the ConceptDraw PRO diagramming and vector drawing software extended with the Frequency Distribution Dashboard solution from the area "What is a Dashboard" of ConceptDraw Solution Park.
Visual dashboard
HR Flowchart Symbols

- Sector diagram - Template | Economic sector weightings | New ...
- Economic sector weightings | Pie Chart Examples and Templates ...
- Economic sector weightings | Pie Donut Chart . Pie Chart Examples ...
- Economic sector weightings | Bar Diagrams for Problem Solving ...
- Pie Chart On Irrigation Facilities In India
- Flow Chart And Piechart In Software Development Economic Sector
- Example Of Pie Chart In Economic
- Opportunities in agro and food processing sector in Punjab | How To ...
- Economic sector weightings | Primary Secondary And Tertiary ...
- Economic Sector Chart