 Entity-Relationship Diagram (ERD)
An Entity-Relationship Diagram (ERD) is a visual presentation of entities and relationships. That type of diagrams is often used in the semi-structured or unstructured data in databases and information systems. At first glance ERD is similar to a flowch
Event-Driven Process Chain Diagram Software

HelpDesk
How to Create a Bank ATM Use Case Diagram

The business processes modeling (BPM) flowchart sample "Event-driven process chain (EPC) diagram" was created on the base of illustration from "Methods for the specification and verification of business processes. 19 - Event-driven process chains. Roberto Bruni. 2011".
"An Event-driven Process Chain (EPC) is a
particular type of flow-chart that can be used for configuring an Enterprise Resource Planning (ERP) implementation.
Supported by many tools (e.g. SAP R/ 3).
EPC Markup Language available (EPML)
as interchange format. ...
EPC overview.
Important notation to model the domain aspects of business processes.
Rather informal notation.
EPC focus is on representing domain concepts and processes (not their formal aspects and technical realization).
It can be used to drive the modeling, analysis and redesign of business process." [cli.di.unipi.it/ ~rbruni/ MPB-12/ 19-EPC.pdf]
The event-driven process chain (EPC) diagram example was drawn using the ConceptDraw PRO diagramming and vector drawing software extended with the Event-driven Process Chain Diagrams solution from the Business Processes area of ConceptDraw Solution Park.
EPC flow chart
-diagram.png--diagram-flowchart-example.png)
BPR Diagram. Business Process Reengineering Example

EPC for Configuring an Enterprise Resource Planning

Block Diagram

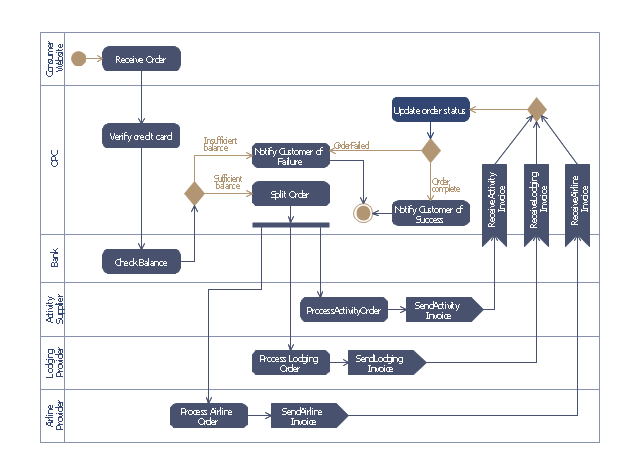
This purchase order processing UML activity diagram was created on the base of activity diagram from the software architecture documentation wiki of the Software Engineering Institute (SEI) of Carnegie Mellon University (CMU).
[wiki.sei.cmu.edu/ sad/ index.php/ Image:PurchaseOrderActivityDiagram.png]
"A purchase order (PO) is a commercial document and first official offer issued by a buyer to a seller, indicating types, quantities, and agreed prices for products or services. Acceptance of a purchase order by a seller forms a contract between the buyer and seller, so no contract exists until the purchase order is accepted. It is used to control the purchasing of products and services from external suppliers.
Creating a purchase order is typically the first step of the purchase to pay process in an ERP system." [Purchase order. Wikipedia]
This purchase order processing UML activity diagram example was created using the ConceptDraw PRO diagramming and vector drawing software extended with the ATM UML Diagrams solution from the Software Development area of ConceptDraw Solution Park.
UML activity diagram of purchase order processing
 Event-driven Process Chain Diagrams
Event-Driven Process Chain Diagrams solution extends ConceptDraw DIAGRAM functionality with event driven process chain templates, samples of EPC engineering and modeling the business processes, and a vector shape library for drawing the EPC diagrams and EPC flowcharts of any complexity. It is one of EPC IT solutions that assist the marketing experts, business specialists, engineers, educators and researchers in resources planning and improving the business processes using the EPC flowchart or EPC diagram. Use the EPC solutions tools to construct the chain of events and functions, to illustrate the structure of a business process control flow, to describe people and tasks for execution the business processes, to identify the inefficient businesses processes and measures required to make them efficient.
Accounting Flowchart Symbols

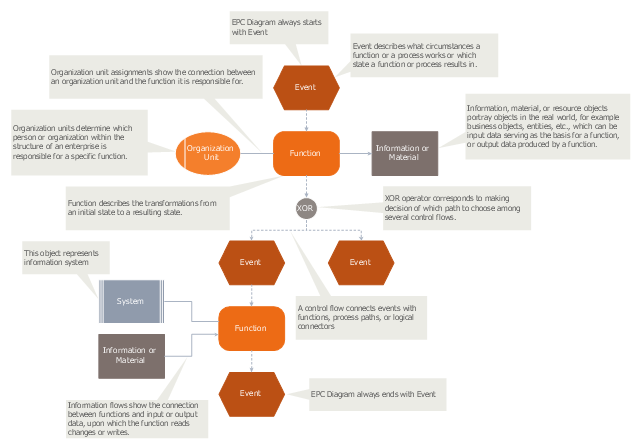
"An Event-driven Process Chain (EPC) is a type of flowchart used for business process modelling. Event-driven Process Chains can be used for configuring an enterprise resource planning (ERP) implementation, and for business process improvement. ...
Businesses use Event-driven Process Chain diagrams to lay out business process work flows, originally in conjunction with SAP R/ 3 modeling, but now more widely. It is used by many companies for modeling, analyzing, and redesigning business processes. The Event-driven Process Chain method was developed within the framework of Architecture of Integrated Information Systems (ARIS). As such it forms the core technique for modeling in ARIS, which serves to link the different views in the so-called control view." [Event-driven process chain. Wikipedia]
The event-driven process chain (EPC) diagram template for the ConceptDraw PRO diagramming and vector drawing software is included in the Event-driven Process Chain Diagrams solution from the Business Processes area of ConceptDraw Solution Park.
EPC diagram template
Accounting Flowchart Symbols
Graphical Symbols to use in EPC diagrams

Design Elements for UML Diagrams

 Business Diagrams
The Business Diagrams Solution extends ConceptDraw DIAGRAM with an extensive collection of professionally designed illustrative samples and a wide variety of vector stencils libraries, which are the real help for all business-related people, business analysts, business managers, business advisers, marketing experts, PR managers, knowledge workers, scientists, and other stakeholders allowing them to design the bright, neat, expressive and attractive Bubble Diagrams, Circle-Spoke Diagrams, Circular Arrows Diagrams, and Venn Diagrams with different quantity of sets in just minutes; and then successfully use them in documents, reports, statistical summaries, and presentations of any style.
Design Element: Chen for Entity Relationship Diagram - ERD

EPC

Sequence Diagram Tool

 Cross-Functional Flowcharts
Cross-functional flowcharts are powerful and useful tool for visualizing and analyzing complex business processes which requires involvement of multiple people, teams or even departments. They let clearly represent a sequence of the process steps, the order of operations, relationships between processes and responsible functional units (such as departments or positions).
UML Object Diagram. Design Elements

- Sales And Distribution Model In Erp Diagram
- Process Flowchart | Data Flow Diagram Model | Entity Relationship ...
- Event-driven process chain (EPC) diagram | | Erp Flowchart Samples
- Process Flowchart | Data Flow Diagram Model | EPC for Configuring ...
- Erp Functional Block Diagram
- Entity-Relationship Diagram (ERD) | ER Diagram for Cloud ...
- Purchase order processing UML activity diagram | EPC diagram ...
- Er Diagram For Erp System
- Business process Flow Chart — Event-Driven Process chain (EPC ...
- Erp Architecture Diagram
- Erp System Architecture Diagram
- Erp Process Flow Diagram
- Flow Chart Symbols | ERD Symbols and Meanings | UML Object ...
- Any Diagrams Representing Erp
- Entity-Relationship Diagram (ERD) | Erp Block Diagram Concept In ...
- Erp System Diagram
- Event-driven process chain (EPC) diagram | Network Diagram ...
- Entity Relationship Diagram Examples | Flow Chart Symbols | Entity ...
- Erp Digram