 Entity-Relationship Diagram (ERD)
An Entity-Relationship Diagram (ERD) is a visual presentation of entities and relationships. That type of diagrams is often used in the semi-structured or unstructured data in databases and information systems. At first glance ERD is similar to a flowch
 Wireless Networks
The Wireless Networks Solution extends ConceptDraw DIAGRAM software with professional diagramming tools, set of wireless network diagram templates and samples, comprehensive library of wireless communications and WLAN objects to help network engineers and designers efficiently design and create Wireless network diagrams that illustrate wireless networks of any speed and complexity, and help to identify all required equipment for construction and updating wireless networks, and calculating their costs.
Cisco Routers. Cisco icons, shapes, stencils and symbols

ER Diagram for Cloud Computing

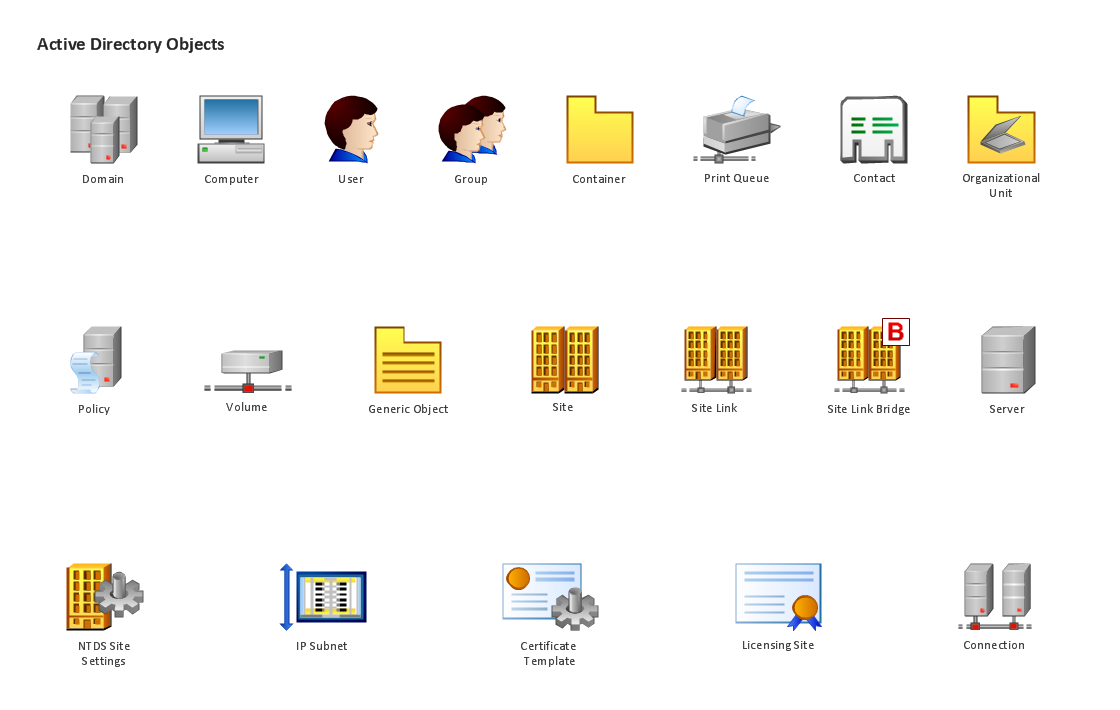
Design Element: Active Directory for Network Diagrams

Rack Diagrams
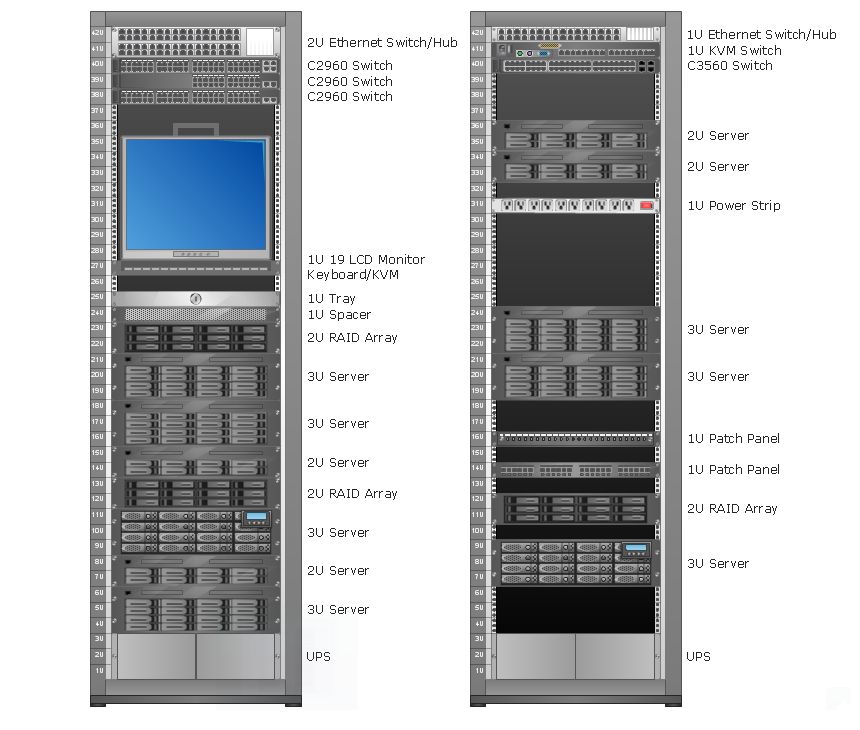
Design Element: Rack Diagram for Network Diagrams
.png)
 Interactive Voice Response Diagrams
Interactive Voice Response Diagrams solution extends ConceptDraw DIAGRAM software with samples, templates and libraries of ready-to-use vector stencils that help create Interactive Voice Response (IVR) diagrams illustrating in details a work of interactive voice response system, the IVR system’s logical and physical structure, Voice-over-Internet Protocol (VoIP) diagrams, and Action VoIP diagrams with representing voice actions on them, to visualize how the computers interact with callers through voice recognition and dual-tone multi-frequency signaling (DTMF) keypad inputs.
 Fault Tree Analysis Diagrams
This solution extends ConceptDraw DIAGRAM.5 or later with templates, fault tree analysis example, samples and a library of vector design elements for drawing FTA diagrams (or negative analytical trees), cause and effect diagrams and fault tree diagrams.
Cloud Computing

 Enterprise Architecture Diagrams
Enterprise Architecture Diagrams solution extends ConceptDraw DIAGRAM software with templates, samples and library of vector stencils for drawing the diagrams of enterprise architecture models.
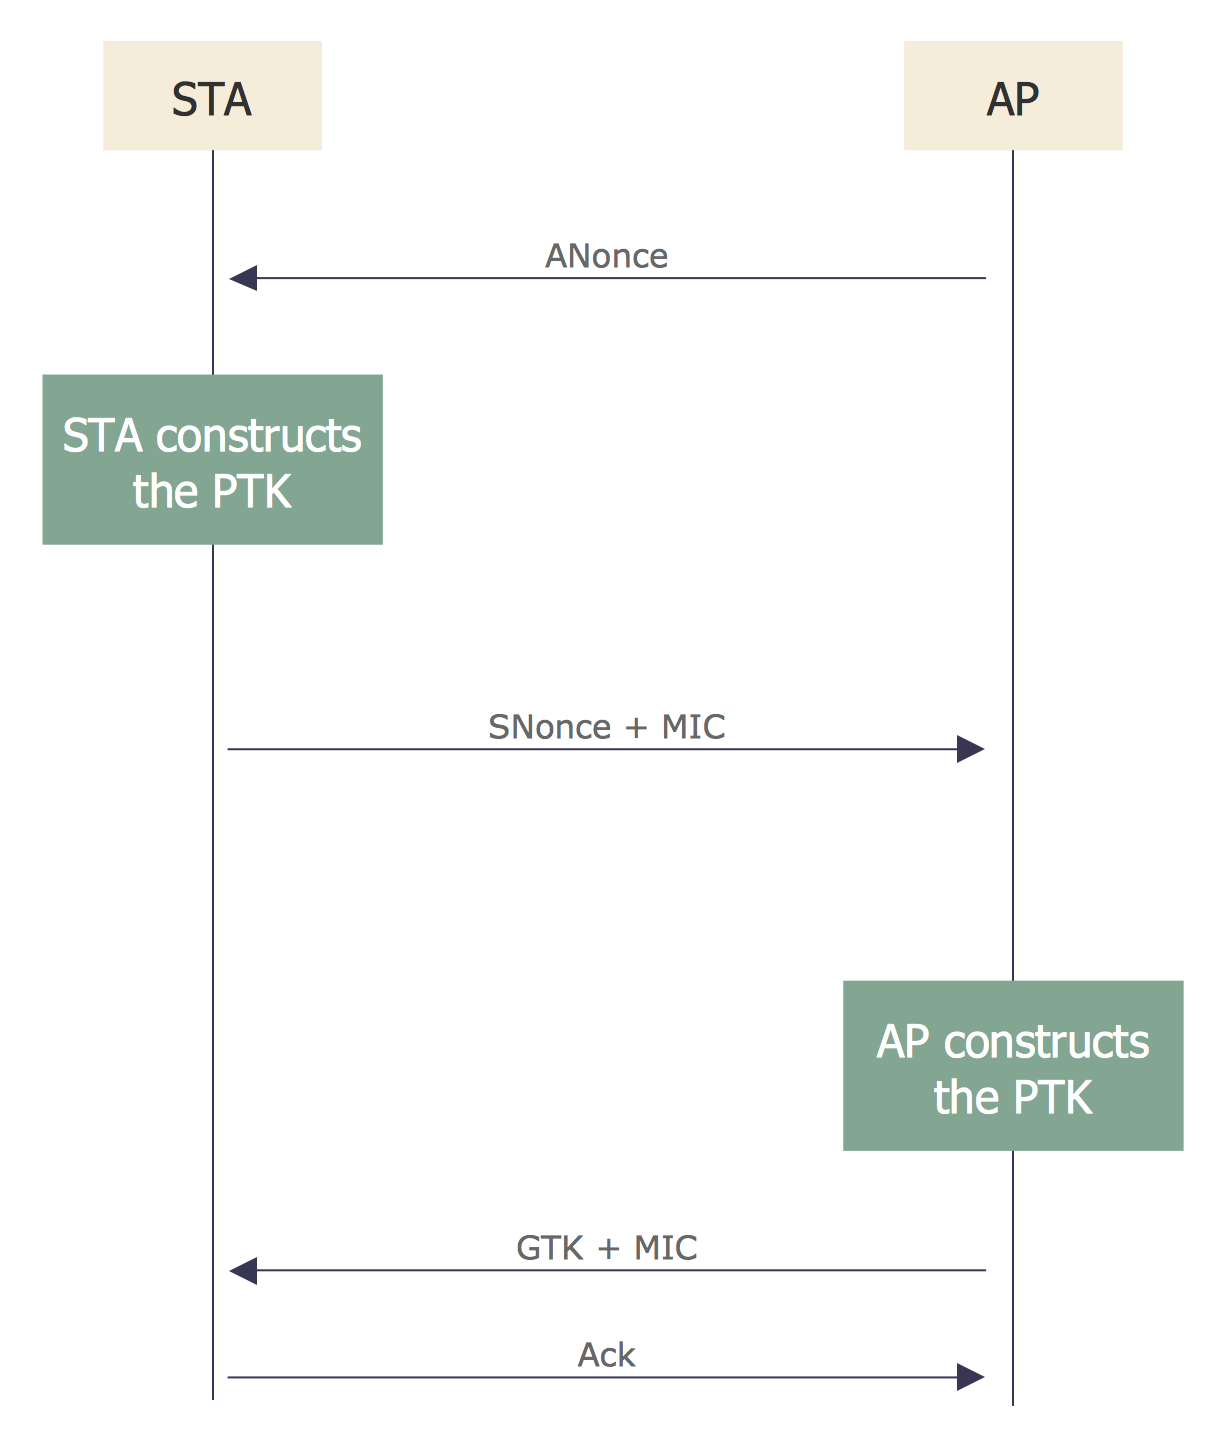
Sequence Diagram for Cloud Computing
 iPhone User Interface
iPhone User Interface solution extends ConceptDraw DIAGRAM software with templates, samples and libraries with large quantity of vector stencils of graphical user interface elements, Apps icons, UI patterns for designing and prototyping of the iOS applic
Software development with ConceptDraw DIAGRAM

Cloud Computing Architecture Diagrams

- Entity Relationship Diagram Examples | Examples of Flowcharts ...
- Mesh Network Topology Diagram | How to Draw a Computer ...
- ER Diagram for Cloud Computing | Diagramming tool - Amazon ...
- ConceptDraw PRO ER Diagram Tool | How to Show the ...
- Tree Network Topology Diagram | Wireless Network LAN | Star ...
- Wireless Network Diagram Examples | Network Diagram Software ...
- Local Area Network Diagram
- Entity-Relationship Diagram ( ERD ) | Interactive Voice Response ...
- Entity-Relationship Diagram ( ERD ) | Enterprise Architecture ...
- Entity-Relationship Diagram ( ERD ) | Telecommunication Network ...
- Entity Relationship Diagram Symbols | Data Flow Diagram Symbols ...
- Entity-Relationship Diagram ( ERD ) | Fault Tree Analysis Diagrams ...
- Entity-Relationship Diagram ( ERD ) | ER Diagram Tool | Entity ...
- Star Network Topology | Tree Network Topology Diagram ...
- Entity-Relationship Diagram ( ERD ) | How to Create an Entity ...
- Entity-Relationship Diagram ( ERD ) | Metro Map | Interactive Voice ...
- Hotel Network Topology Diagram | Computer and Networks Area ...
- Entity Relationship Diagram Examples | Local area network (LAN ...
- GPS operation diagram | Telecommunication Network Diagrams ...
- Entity-Relationship Diagram ( ERD ) | Interactive Voice Response ...